


The price of Chainlink’s LINK token is climbing above the $20.00 mark, showing a gain of over 5%. There’s speculation it could continue rising and target the $25.00 resistance level.
Chainlink’s price is looking good above $20.00 against the US dollar. It’s trading above $20.50 and the 100 simple moving average on the 4-hour chart. A significant development was breaking a bearish trend line near $20.00. According to data from Kraken, if the price surpasses the $22.00 resistance area, it might rally even more.
Chainlink Bulls Push Price Higher
In recent sessions, Chainlink bulls successfully surpassed key obstacles around $18.50. This followed a period where the LINK price stabilized above $16.75, sparking a fresh upward trend.
A significant breakthrough occurred as the bearish trend line near $20.00 was breached on the 4-hour LINK/USD chart. The bulls then drove the pair above $22.00, resulting in a new multi-month high at $22.85 before a downward correction ensued.
Despite a dip below $22.00, the price remains above the $20.50 level and the 100 simple moving average (4 hours), showcasing a 5% increase. This performance outpaces Bitcoin and Ethereum. If bullish momentum persists, the price could continue its ascent. Immediate resistance is anticipated around $21.80.
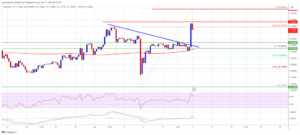
Source: LINKUSD on TradingView.com
The $22.00 zone marks a significant hurdle. Surpassing it could signal a sustained uptrend toward $23.00 and $24.20 levels. Further resistance lies near $24.80, potentially leading to a test of $25.00.
Potential Downside Scenarios for Chainlink
If Chainlink’s price fails to surpass the $22.00 resistance level, a downside correction could ensue. Initial support is anticipated near the $21.00 mark.
The next significant support level lies around $20.00 or the 50% Fibonacci retracement level, calculated from the upward movement between the $16.75 swing low and the $22.85 high. If these levels are breached, the price might test $18.80, with further losses potentially leading to a downturn toward $17.65 in the near future.
Technical Indicators
- On the 4-hour chart, the MACD for LINK/USD is showing bullish momentum. Additionally, the RSI (Relative Strength Index) is above the 50 level, indicating positive sentiment.
- Major support levels are identified at $21.00 and $20.00, while major resistance levels stand at $22.00 and $23.00.
Important: Please note that this article is only meant to provide information and should not be taken as legal, tax, investment, financial, or any other type of advice.
Join Cryptos Headlines Community
Follow Cryptos Headlines on Google News
Author