


Despite minor fluctuations, Ethereum, the largest smart contracts token, remains on a strong bullish trend. The focus is on the impact of recent developments and overall market sentiment as it aims for sustained positive momentum.

Ethereum’s price prediction suggests a bullish trend in the cryptocurrency market, with the current price at $2,281. Despite a minor 0.41% dip in the past day, Ethereum has demonstrated resilience by consistently maintaining a value above $2,200 in recent months. This pattern indicates a robust bullish sentiment among investors.
Ethereum Price Resilience Amid Market Volatility
Ethereum’s robust performance over the past year, marked by a substantial 46% increase, reflects a growing interest among investors. In the recent 24 hours, Ethereum witnessed a surge in trading volume, reaching $9.29 billion, indicative of heightened bullish sentiment and the potential for further value growth.
Despite facing a 6% weekly decline and fluctuating between $2,300 and $2,400, the prevailing market momentum suggests an optimistic outlook. Ethereum maintains its position as the second-largest cryptocurrency, boasting a market capitalization of $285 billion, highlighting its sustained prominence in the cryptocurrency sphere.
Ethereum’s Price Outlook: ETF Speculation Sparks Consolidation
Crypto Busy, a renowned crypto education source, delves into Ethereum’s recent market dynamics post-speculation about an Ethereum-based Exchange Traded Fund (ETF). The initial surge, fueled by ETF excitement, has transitioned into a consolidation phase, indicating a stabilization in Ethereum’s value.
#EthereumNameService $ENS chart update: 👇
Currently consolidating after getting a huge pump from the $ETH ETF speculation.
We can see a double resistance as it approach the diagonal and horizontal trendline.
Watch out! pic.twitter.com/5TD9IDUvEB
— CryptoBusy (@CryptoBusy) January 22, 2024
The analysis from Crypto Busy underscores a pivotal moment for Ethereum, pointing to a double resistance scenario formed at the convergence of Ethereum’s price trajectory with both a diagonal and a horizontal trendline. Following the ETF speculation, Ethereum’s value reached a milestone, exceeding $2,600, signaling potential for further market gains.
The breaking of the critical $3,000 resistance level holds significance, potentially paving the way for a substantial price increase, with the next major hurdle situated around $3,500. A successful breach could trigger a bullish trend, pushing Ethereum towards the $4,000 mark. Persistent upward momentum beyond $4,000 might propel Ethereum’s value to the $4,800 resistance level.
Ethereum’s Critical Levels and Technical Indicators: ETF Impact Analysis
The potential outcome for Ethereum hinges on its ability to surpass the $3,000 threshold, with failure marking a bearish turn. The initial support level in this scenario is around $2,000, and a further decline, especially below $1,900, could amplify the downturn, leading to a more significant reduction in Ethereum’s value. The $3,000 and $1,900 levels emerge as pivotal determinants of Ethereum’s short-term market trajectory.
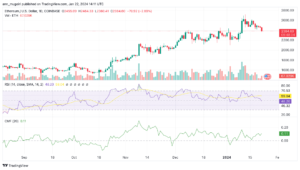
Ethereum price Chart: Tradingview
Technical indicators provide mixed signals. The Moving Average Convergence Divergence (MACD) on the daily chart indicates a bullish trend, with the MACD line positioned above its signal line. Conversely, the Relative Strength Index (RSI) signals a bearish market environment, with readings below the 50 mark on the daily chart. The Chaikin Money Flow (CMF) is positive at $0.11, pointing to bullish pressure in the near term.
Important: Please note that this article is only meant to provide information and should not be taken as legal, tax, investment, financial, or any other type of advice.
Join Cryptos Headlines Community
Follow Cryptos Headlines on Google News
Author