


 Tops as Ethereum Meme Coin")
 Jumps 5% After Delisting: Is $190 Next?")
Ethereum’s price remains uncertain and shows a sideways trend within a narrow range. The market lacks a clear direction, making it challenging to predict future trends. However, on lower time frames, there are indications of an ascending triangle pattern forming. Traders can consider using this setup to identify potential entry opportunities in ETH.

Key points:
- If Ethereum breaks above the $1838 resistance level, it could lead to increased buying activity.
- The long-term trend of Ethereum remains bullish, supported by a long-standing upward trendline.
- Intraday trading volume for Ether is $3.3 billion, indicating a 16% decrease compared to previous levels.
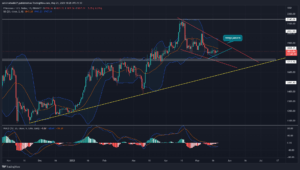
Source- Tradingview
Currently, the price of Ethereum is $1810 and it exhibits uncertain price movement on the daily chart. Despite overall market volatility, Ethereum’s price is responding to both the upward trendline and the horizontal resistance at $1838, indicating the formation of an ascending triangle pattern.
Also Read This: US President Targets Crypto, Vows To Reject Debt Deal Favoring Crypto Traders
The typical expectation for this pattern is a bullish breakout above the horizontal resistance level. If this breakout occurs, it could lead to a price increase of approximately 3%, bringing the price closer to testing the resistance trendline of the wedge pattern.
The current correction in Ethereum price is influenced by this chart pattern, and its completion is important for buyers to initiate a new recovery rally. If the pattern is successfully completed, it could drive the ETH price towards its previous highest point.
Conversely, a breakdown below the triangle support will extend the retracement phase for a few more trading days.
Moving Average Convergence Divergence (MACD) is a technical indicator. If the MACD line (blue) crosses above the signal line (orange) in a bullish manner, it could motivate buyers to attempt breaking the resistance trendline.
The lower band of the Bollinger Bands indicator is still moving downward, suggesting that selling pressure is still present.
Will Ethereum Price revisit $2000 before May End?
In order for Ethereum’s price to reach $2000, it would need to grow by 10% within the remaining 10 days of May. While this increase is possible, the current market uncertainty has reduced the likelihood of it happening. Coin holders should wait for a clear signal, such as a breakout from a wedge pattern, before expecting the $2000 target to be achieved.
Author