Ethereum is doing well as more people are getting involved, with the number of Ethereum addresses reaching an all-time high. Although it faced some drops recently, Ethereum is bouncing back, now trading at around $3,615, with a market value of $433 billion.
The recent increase in the number of Ethereum (ETH) accounts holding a balance and a decrease in the amount of ETH available on exchanges are positive signs for its future value.
Ethereum’s Bullish Momentum: Signs of Continued Growth

Source: Santiment
Ethereum has shown resilience in the face of market challenges, surging past the $3,000 mark last month and currently holding strong around $3,615. This upward trajectory reflects a growing interest and investment from the community.
The recent milestone of Ethereum’s positive-balancing addresses reaching a record high indicates a surge in investor participation, suggesting a strengthening market sentiment. Moreover, the medium-term MVRV ratio subtly signals bullishness, further supporting positive expectations for Ethereum.
Another promising indicator is the decrease in the percentage of total Ethereum supply available for active trading, dropping from 15.8% to approximately 11%. This reduction in selling pressure could exacerbate supply shortages, potentially driving ETH prices higher.
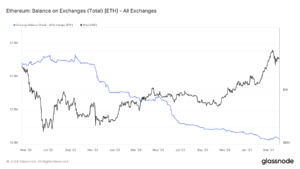
Source: Glassnode
Considering Ethereum’s 57% price growth since the beginning of the year, it’s plausible to expect its value to continue climbing toward the $4,000 target. These developments paint a bullish picture for Ethereum, with limited coin availability and heightened investment activity likely to play key roles in its future price appreciation.
Analyzing Ethereum’s Current Price and Technical Indicators
Ethereum (ETH-USD) is currently trading around $3,523.30 USD, marking a decrease of $107.91, or approximately 2.97%, from its previous recorded value.
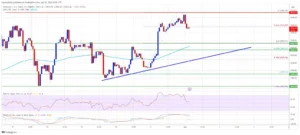
Source: Tradingview
Technical indicators such as the Exponential Moving Average (EMA), Relative Strength Index (RSI), and Moving Average Convergence Divergence (MACD) offer insights into Ethereum’s market sentiment. The EMA indicates a recent uptrend, while the RSI hovers in the neutral zone, trending towards overbought territory. Additionally, the MACD histogram suggests a decline in bullish momentum.
Further analysis involves Fibonacci levels, which serve as potential support or resistance areas. Identifying confluence between these levels can help determine optimal entry or exit points for traders.
In trading, you must always be prepared for the best and the worst!
The most brutal scenario for #Ethereum right now is breaching the $3,400 support level. Such a move could confirm a bear pennant formation on the daily chart, potentially triggering a major correction for $ETH… pic.twitter.com/LIXyuz8NlI
— Ali (@ali_charts) April 1, 2024
Analyst Ali Martinez highlights a challenging scenario for Ethereum, suggesting the possibility of breaking the $3,400 support level. This potential breach could lead to the formation of a bearish pennant on the daily chart, signaling a significant correction down to $2,800 for ETH.
Important: Please note that this article is only meant to provide information and should not be taken as legal, tax, investment, financial, or any other type of advice.
Join Cryptos Headlines Community
Follow Cryptos Headlines on Google News
Author