
On Wednesday, April 3, Bitcoin (BTC) went up by 0.72%, reaching a closing price of $66,062. This increase was influenced by positive US economic indicators and the flow of BTC-spot exchange-traded funds (ETFs) on April 2 and April 3.
Looking ahead to Thursday, investors should pay attention to BTC-spot ETF market flow data, discussions among US lawmakers, and comments from the Federal Reserve, as these factors may impact Bitcoin’s performance.
BTC Gains: US Economic Indicators and Fed Chair Powell’s Contribution
Bitcoin (BTC) experienced a gain of 0.72% on Wednesday, April 3, which partially reversed a 5.95% decline observed on Tuesday. The day concluded with BTC reaching a price of $66,062.
An unexpected decline in the US ISM Services PMI (Purchasing Managers’ Index) offset the impact of stronger-than-anticipated ADP nonfarm payroll figures. The US ISM Services PMI dropped from 52.6 to 51.4 in March. Conversely, according to the ADP report, nonfarm payrolls showed a significant increase of 184,000 jobs in March. This contrasted with a 155,000-job increase reported in February.
Federal Reserve Chair Powell’s statements also contributed to the day’s gains. He reiterated the Fed’s intention to lower interest rates within the year.
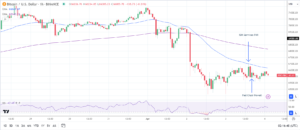
BTCUSD 040424 Hourly Chart: Source – TradingView
BTC-Spot ETF Market Influence
BTC’s performance reflected the impact of the BTC-spot ETF market on investor sentiment.
Tuesday, April 2nd Insights: On Tuesday, April 2nd, iShares Bitcoin Trust (IBIT) observed net inflows of $150.5 million, slightly lower than the $165.9 million reported on Monday, April 1st. Despite this, IBIT inflows offset net outflows from Grayscale Bitcoin Trust (GBTC) and ARK 21Shares Bitcoin ETH (ARKB). Overall, the BTC-spot ETF market recorded net inflows of $40.3 million on April 2nd.
- GBTC experienced net outflows of $81.9 million, down from $302.6 million on April 1st.
- ARKB witnessed net outflows rise from $0.3 million (April 1st) to $87.5 million (April 2nd).
- Fidelity Wise Origin Fund (FBTC) saw net inflows increase to $44.8 million from $44.0 million on April 1st.
Early Wednesday’s BTC-spot ETF market faced selling pressure, anticipating the IBIT flow data.
Wednesday, April 3rd Outlook: For Wednesday, April 3rd, the BTC-spot ETF market anticipated a second day of net inflows. Pending IBIT flow data, the market registered net inflows of $71.5 million.
- GBTC recorded net outflows of $75.1 million.
- FBTC observed net inflows of $116.7 million.
- Bitwise Bitcoin ETF (BITB) contributed with net inflows of $23.0 million.
Continued net inflows could drive buyer demand for BTC and the broader crypto market. However, investor attention may shift towards the Friday US Jobs Report. If the report surpasses expectations, it may challenge assumptions of a June Fed rate cut and test appetite for riskier assets.
BTC Price Analysis and Market Outlook
BTC maintained its position above both the 50-day and 200-day Exponential Moving Averages (EMAs), reinforcing bullish price signals.
A breakthrough above the $67,500 mark would empower the bulls to challenge the $69,000 resistance level. Surpassing this level could potentially pave the way for revisiting the all-time high (ATH) of $73,808 reached on March 14.
On Thursday, investors should pay attention to BTC-spot ETF market flow data, comments from the Federal Reserve, and any activity from the Securities and Exchange Commission (SEC).
Alternatively, a decline below the $65,000 mark could indicate a breach of the $64,000 support level.
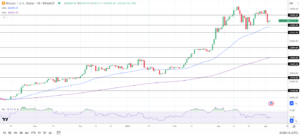
BTCUSD 040424 Daily Chart: Source – TradingView
With a 14-Daily Relative Strength Index (RSI) reading of 48.72, BTC may decline below the 50-day EMA before reaching oversold territory.
ETH Price Analysis and Market Outlook
ETH remained positioned below the 50-day Exponential Moving Average (EMA) while maintaining a strong position above the 200-day EMA. These EMAs suggest bearish signals in the near term but affirm bullish signals over the longer term.
A breakthrough above the 50-day EMA could propel ETH towards the $3,480 resistance level. Surpassing this level might lead to a potential challenge of the $3,650 mark.
Investors should pay attention to discussions surrounding ETH-spot ETFs as the May approval window approaches.
Alternatively, a decline below the $3,244 support level could indicate a further drop towards the $3,033 support level.
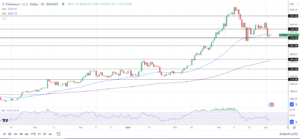
ETHUSD 040424 Daily Chart: Source – TradingView
With a 14-period Daily Relative Strength Index (RSI) reading of 44.23, ETH may experience a decline towards the $3,033 support level before entering oversold territory.
Important: Please note that this article is only meant to provide information and should not be taken as legal, tax, investment, financial, or any other type of advice.
Join Cryptos Headlines Community
Follow Cryptos Headlines on Google News
Author