
Polkadot’s price was tracing a bullish pattern, suggesting a possible decline to $7.9 before initiating a bullish upturn. However, it recently fell below a crucial support level, triggering a bearish trend and leading to a significant decrease in its market capitalization.
Despite this, a new bullish pattern has emerged on Polkadot’s chart, indicating a potential reversal in its fortunes.
Polkadot’s Battle with Bearish Trends Amid Hope for Bullish Reversal
Polkadot faced a critical juncture recently, where it needed to test its support level around $9.2 to kickstart a bullish momentum. However, it failed to reach this crucial point, resulting in a continuous decline in value. Over the past week, DOT recorded a significant drop of more than 13%, with a 2% decrease in the last 24 hours alone. Currently trading at $8.28, Polkadot’s market cap stands at over $11.8 billion.
Despite these challenges, there are signs of hope for investors. FLASH, a renowned crypto analyst, highlighted a bullish pattern forming on DOT’s chart, suggesting a potential uptrend. However, it’s important to note that Polkadot’s price is still within this pattern, indicating the possibility of further losses before a breakout and subsequent bullish rally. According to analysis, there’s a high likelihood of DOT testing $7.9 before experiencing a breakout above the resistance level.
Analyzing Polkadot’s Derivatives Market Metrics Amid Bearish Trends
As Polkadot faced the possibility of further decline, a closer look at its derivatives market metrics was warranted. Coinglass’s data revealed a notable rise in DOT’s open interest despite its falling price. Typically, an increase in open interest suggests a continuation of the prevailing price trend, indicating a potential further decline. Additionally, the token’s funding rate declined in recent days, adding to the bearish sentiment.
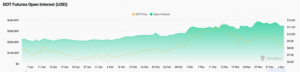
Source: Coinglass
Technical indicators also favored the sellers, with Polkadot’s MACD displaying a bearish advantage and the Relative Strength Index (RSI) showing a downtick, signaling a potential price drop. However, the Money Flow Index (MFI) exhibited some bullish tendencies, trending upwards.
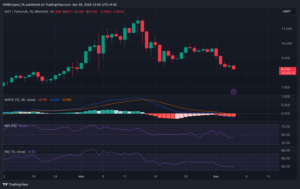
Source: TradingView
Despite these mixed signals, a bullish reversal for DOT might encounter obstacles at various resistance levels. Analysis from Hyblock Capital’s data indicated that Polkadot could face increased liquidation around $8.8. Therefore, for Polkadot to initiate a sustained bullish rally, it needs to surpass the resistance level in the near future.
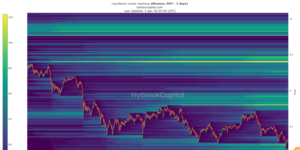
Source: Hyblock Capital
Important: Please note that this article is only meant to provide information and should not be taken as legal, tax, investment, financial, or any other type of advice.
Join Cryptos Headlines Community
Follow Cryptos Headlines on Google News
Author