


Litecoin’s (LTC) price is currently above a support line that has been in place for a long time, indicating a significant level of historical support. However, it is also within a short-term pattern that suggests a bearish trend may be forming.
Litecoin’s (LTC) price has remained relatively stable without experiencing significant ups and downs for almost a year now. It raises the question of how much longer this trend will persist.
Litecoin (LTC) Technical Analysis: Long-Term Trends and RSI
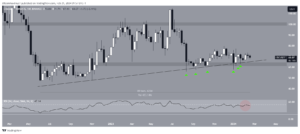
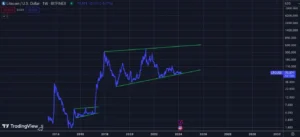
LTC/USDT Weekly Chart. Source: TradingView
On the weekly time frame, Litecoin (LTC) has been following an ascending support trend line since June 2022. Over the past year and a half, this trend line has been tested six times, as indicated by green icons. However, these tests have not led to significant upward movements in the LTC price. The trend line has been in place for more than 620 days, highlighting its significance in LTC’s price action. Additionally, LTC is currently trading above a long-term horizontal support area.
In terms of the Relative Strength Index (RSI), which is used by traders to gauge momentum and identify overbought or oversold conditions, the weekly RSI for LTC is inconclusive. Readings above 50, coupled with an upward trend, typically indicate bullish momentum, while readings below 50 suggest bearish momentum. However, the RSI for LTC is currently increasing but remains below 50, indicating an uncertain trend direction.
Analysis of Litecoin (LTC) Price Predictions and Technical Indicators
LTC/USDT Weekly Chart. Source: X
Cryptocurrency traders and analysts on X have expressed optimism regarding the future trend of LTC. CryptoSurf tweeted about a long-term fractal suggesting that LTC is at the beginning of a bullish cycle.
NebraskanGooner and CryptoMoneyKing also share positive sentiments, indicating that LTC’s price could see appreciation if it breaks above $72. However, the LTC price action on the daily chart leans towards bearishness.
Since September 2023, LTC’s movement has been confined within an ascending parallel channel, indicating a corrective increase. Moreover, the significant overlap within this pattern suggests further correction. Currently, LTC is trading in the lower portion of the channel, with the RSI falling below 50.
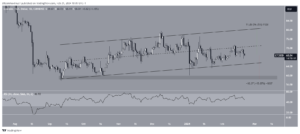
LTC/USDT Daily Chart. Source: TradingView
If LTC breaks down from the channel, it could see a 15% decline to the next support level at $58. However, despite this bearish prediction, surpassing the channel’s midline could trigger a 16% increase towards the resistance trend line at $80.
Important: Please note that this article is only meant to provide information and should not be taken as legal, tax, investment, financial, or any other type of advice.
Join Cryptos Headlines Community
Follow Cryptos Headlines on Google News
Author