The Dogecoin (DOGE) price recently broke free from both long- and short-term trend lines that were holding it back. However, after this breakout, on November 11, the DOGE price increase stopped.
In the weekly timeframe technical analysis, Dogecoin’s price made a notable breakthrough in October, breaking free from a descending resistance trend line that had persisted for 900 days. This trend line had previously led to three significant rejections (marked by red icons). Following the breakout, DOGE reached a peak of $0.082 before experiencing a slight decline. Post-breakout, the weekly Relative Strength Index (RSI) moved above 50.
The RSI serves as a momentum indicator for traders to assess whether a market is overbought or oversold, guiding decisions on asset accumulation or sale. Readings above 50, especially in an upward trend, suggest that bulls maintain an advantage, while readings below 50 indicate the opposite. A movement above 50 is considered a positive sign.
Renowned cryptocurrency trader Crypto Tony and skeptic-turned-supporter Rekt Capital both acknowledged the breakout from the descending resistance trend line, adding weight to the positive sentiment surrounding Dogecoin’s recent price movements.

DOGE/USDT Weekly Chart. Source: TradingView
Mixed Signals for Dogecoin (DOGE) in Short-Term Analysis
While the weekly timeframe presents a clear bullish trend, the daily outlook raises doubts about the sustainability of the upward movement in the short term. The primary concern stems from the daily Relative Strength Index (RSI).
Recent highs on the daily RSI show a bearish divergence, where a decrease in momentum follows an increase in price, often signaling potential downward movements.
Adding to the uncertainty are consecutive long upper wicks (identified by red icons), indicating signs of selling pressure.
Should the DOGE price decline, a 15% drop to the nearest support area at $0.067 is anticipated.
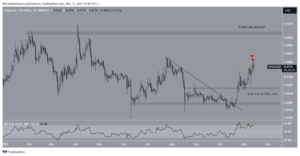
DOGE/USD Daily Chart. Source: TradingView
Despite this cautious outlook, a breakthrough above the November peak of $0.082 would signal the correction’s conclusion. In such a scenario, a projected 24% increase toward the next resistance level at $0.100 is expected.
Important: Please note that this article is only meant to provide information and should not be taken as legal, tax, investment, financial, or any other type of advice.
Join Cryptos Headlines Community
Follow Cryptos Headlines on Google News
Author