
Litecoin’s price against Bitcoin is showing bullish signs, leading to speculation that LTC might experience a notable increase in value.
However, the overall market trend this month has been more bearish. So, while there’s hope for a substantial LTC price increase if the positive signals strengthen, it’s wise to approach the current market with caution.
Litecoin Price Analysis: Potential for Bullish Rebound
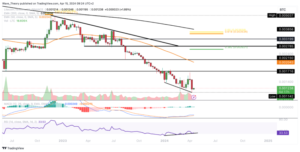
The Litecoin price has faced a significant drop of more than 37.3% this month, declining from a local peak near $113. Currently, LTC is hovering around the golden ratio support level at approximately $80, suggesting a possible opportunity for a bullish rebound.
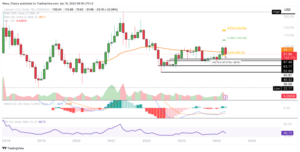
Litecoin (LTC/USD) Price Chart. Source: Tradingview
Moreover, on the monthly chart, the Moving Average Convergence Divergence (MACD) lines have formed a bullish crossover, indicating potential upward momentum. However, the MACD histogram is showing a downward trend, which could signal bearish pressure. Additionally, the Relative Strength Index (RSI) is in neutral territory, suggesting a balanced market sentiment.
Litecoin Price Analysis: Mixed Signals Ahead
Last week, the LTC price briefly fell below the critical Golden Ratio support level of approximately $80 before rebounding to close the week exactly at this pivotal point. This rebound suggests the potential for an upward movement in the current week.
However, caution is warranted as the MACD histogram on the weekly chart has been signaling bearish trends since the previous week. This could potentially lead to a bearish crossover of the MACD lines in the near future.
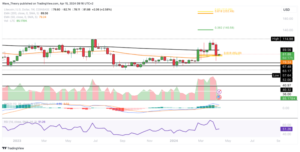
Litecoin (LTC/USD) Price Chart. Source: Tradingview
Adding to the mixed signals, the Exponential Moving Averages (EMAs) are displaying a death cross pattern on the weekly chart, indicating a bearish trend in the medium term.
Despite these concerning indicators, the Relative Strength Index (RSI) remains in neutral territory, offering no clear signals of bullish or bearish momentum. Investors should closely monitor these factors for a clearer understanding of LTC’s price trajectory.
Litecoin’s Price Analysis: Mixed Signals and Key Levels
In Litecoin’s daily chart, a golden crossover persists, signaling a sustained bullish trend in the short to medium term. However, a recent bearish crossover of the MACD lines adds a layer of uncertainty to the outlook.
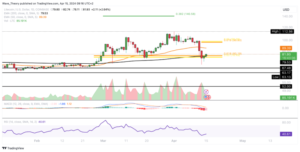
Litecoin (LTC/USD) Price Chart. Source: Tradingview
Despite the bearish MACD crossover, the MACD histogram shows bullish momentum today, while the Relative Strength Index (RSI) remains neutral. These conflicting signals make it challenging to determine LTC’s immediate price direction.
Looking ahead, LTC faces two significant hurdles. The first resistance lies around $89.4, aligned with the 50-day Exponential Moving Average (EMA). Additionally, formidable Fibonacci resistance is anticipated around $97.
A breakthrough above the golden ratio at $97 would mark the end of the corrective phase, potentially opening the path for LTC to target the 0.382 Fibonacci resistance at roughly $140.
Conversely, if LTC encounters downward pressure, substantial support is expected between $63 and $67.5. These levels will be crucial to watch as they could determine the cryptocurrency’s short-term trajectory.
Litecoin’s Short-Term Outlook: Bullish Signals Amidst Corrective Phase
In the short term, Litecoin (LTC) shows signs of potential upward movement towards the Golden Ratio level, approximately at $97, indicating a potential increase of around 18%. The recent bullish crossover of the MACD lines in the 4-hour (4H) chart, accompanied by a bullish uptick in the MACD histogram, adds credence to this upward trajectory. Additionally, the Relative Strength Index (RSI) remains in neutral territory, suggesting room for further gains.
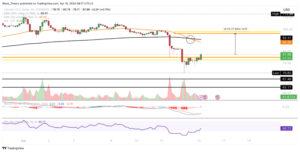
Litecoin (LTC/USD) Price Chart. Source: Tradingview
However, it’s crucial to consider the broader trend, which has already been confirmed as bearish by the Exponential Moving Averages’ (EMAs) death cross. This emphasizes that LTC is currently in an ongoing corrective phase, which may limit the extent of any short-term bullish movements. Despite the bullish signals in the near term, investors should remain cautious and monitor key support and resistance levels closely.
LTC Potential Reversal: Indicators & Resistance
Despite the prolonged downward trend in LTC’s price against Bitcoin, there are emerging signs of a potential reversal. Notably, the Moving Average Convergence Divergence (MACD) lines have formed a bullish crossover on the weekly chart, suggesting a shift in momentum. Furthermore, the Relative Strength Index (RSI) indicates a bullish divergence, indicating that despite the price decline, bullish pressure may be building.
LTC/BTC Price Chart. Source: Tradingview
However, should Litecoin initiate an upward trajectory, it will encounter significant resistance levels along the way. Key resistance zones lie between approximately 0.001716 BTC and 0.00215 BTC, where previous price action suggests strong selling interest. Additionally, the 50-week Exponential Moving Average (EMA) presents a formidable barrier around 0.00204 BTC, further reinforcing the significance of these resistance levels. These zones may pose challenges for LTC’s potential recovery against Bitcoin, requiring careful monitoring by investors.
Important: Please note that this article is only meant to provide information and should not be taken as legal, tax, investment, financial, or any other type of advice.
Join Cryptos Headlines Community
Follow Cryptos Headlines on Google News
Author