
The creation of a bullish reversal pattern suggests that Pepe Coin might be gearing up for a comeback.
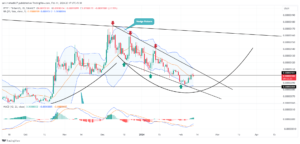
PEPE’s price correction is expected to persist while the wedge pattern holds. A potential bounce could occur around the combined support of $0.00000084 and the 78.6% Fibonacci retracement level. The current 24-hour trading volume for Pepe Coin stands at $56.4 million, reflecting a 29% loss.
Pepe Coin Price Analysis: A Potential Reversal Signal
In the past two months, Pepe Coin, the frog-themed meme cryptocurrency, has been going down steadily on the daily chart. It fell by almost half, from its highest point of $0.00000175 to a low of $0.00000086, which has been tough for investors. But when we look at the technical analysis of the charts, it seems this drop might be part of a significant pattern that could signal a change in direction. This suggests there could be a chance for buyers to jump back into the market.
PEPE Price| Tradingview
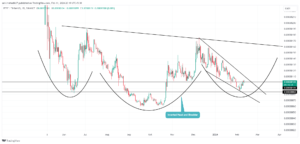
According to a recent analysis by @alichart, Pepe Coin is showing signs that it might be about to start going up on its 3-day chart. It’s making the right side of a pattern called a head-and-shoulders, and a tool called the TD Sequential indicator has said it’s time to buy. All these things together mean that Pepe Coin might start going up, which is catching the eye of people who trade and invest.
$PEPE is currently showing signs of forming the right shoulder of a head-and-shoulders pattern on its 3-day chart. Additionally, the TD Sequential indicator has issued a buy signal within this timeframe, suggesting an anticipated bullish impulse for #PEPE. pic.twitter.com/brSr7uln3z
— Ali (@ali_charts) February 10, 2024
The inverted head and shoulders pattern is a special shape on a chart that usually means the price might start going up after going down for a while. It looks like three bumps, with the one in the middle being the lowest. With the wider cryptocurrency market starting to recover, Pepe Coin has gone up in price from $0.00000086 to $0.00000102 in just one week, which is a gain of 16%. If this pattern keeps going like it usually does, Pepe’s price might climb up to $0.00000162, which could mean a gain of 55%.
Deeper Analysis of Pepe Coin Price Trends
PEPE Price| Tradingview
After closely looking at the daily chart, it’s clear that Pepe Coin’s price is stuck in a falling wedge pattern. This pattern suggests that the current downtrend might be coming to an end, and there’s a chance for a big recovery. If things go well for buyers, breaking out of this pattern could kick off a new upward trend, giving traders a chance to get in for the long haul.
Depending on when this breakout happens, it could take about 2-3 weeks for Pepe’s price to get back to $0.0000014, showing a possible change in direction soon.
Support Indicators
The Bollinger Band: When the lower part of this band starts going up, it gives more support to people buying Pepe Coin at $0.00000084. This might make them feel more confident that the price will keep going up.
Moving Average Convergence Divergence (MACD): When the MACD line crosses over the signal line, it’s a sign that buyers are starting to take control again. This could mean Pepe Coin’s price will start going up, adding to the chances of an upward movement.
Important: Please note that this article is only meant to provide information and should not be taken as legal, tax, investment, financial, or any other type of advice.
Join Cryptos Headlines Community
Follow Cryptos Headlines on Google News
Author