


The price of MATIC is holding steady, staying above the support level of $0.58. If it manages to surpass the resistance at $0.650, Polygon could see a boost in its bullish momentum.
The price of MATIC is displaying favorable indications as it hovers below the $0.65 resistance in comparison to the US dollar. Currently, the price is trading above $0.60 and is also positioned above the 100 simple moving average on the 4-hour chart.
Notably, there is a significant contracting triangle in the making, with resistance situated around $0.640 as observed on the MATIC/USD pair’s 4-hour chart, with data sourced from Kraken. If the pair successfully surpasses the resistance levels at $0.640 and $0.650, it may potentially continue its upward trajectory.
Polygon’s MATIC Price Targets Upside Movement
After establishing a base above the $0.50 mark, Polygon’s price embarked on a consistent upward trend. MATIC overcame several obstacles, primarily around the $0.550 level, effectively transitioning into a positive zone alongside cryptocurrencies like Bitcoin and Ethereum.
This ascent led to a breakthrough past the $0.60 resistance, propelling the price to a peak of $0.6646. However, there was a minor dip below the $0.640 level in a recent correction. The price temporarily fell beneath the 23.6% Fibonacci retracement level of the upward journey from the $0.5032 swing low to the $0.6646 high.
At present, MATIC is trading above the $0.60 level and remains positioned favorably with the support of the 100 simple moving average over a 4-hour span. Furthermore, a significant contracting triangle is taking shape, featuring resistance near $0.640, observable on the 4-hour chart of the MATIC/USD pair.
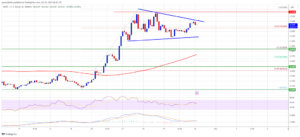
Source: MATICUSD on TradingView.com
The immediate hurdle to overcome is around the $0.640 level, with the primary major resistance found at approximately $0.650. A successful breakthrough above this $0.650 resistance could set the stage for further gains. The subsequent significant resistance level to contend with is near $0.665. If the price manages to confidently breach this $0.665 resistance, it could initiate a sustained uptrend. In such a scenario, there’s potential for the price to aim for levels around $0.680 or even $0.700.
Possible Pullback in MATIC Price?
If MATIC’s price fails to surpass the $0.640 resistance, there could be a downward correction. The initial support in case of a decline is around the $0.6100 level.
The primary support level is situated near $0.584 or the 50% Fibonacci retracement level from the price’s upward journey starting at the $0.5032 swing low and reaching the $0.6646 high. Should the price dip below the $0.584 level, it might trigger a new decline toward $0.550. The following major support level is approximately $0.532.
Technical Indicators
- 4-hour MACD: The MACD for MATIC/USD is showing signs of increasing bullish momentum.
- 4-hour RSI (Relative Strength Index): The RSI for MATIC/USD is currently above the 50 level.
- Key Support Levels: $0.610 and $0.584.
- Key Resistance Levels: $0.640, $0.650, and $0.700.
Important: Please note that this article is only meant to provide information and should not be taken as legal, tax, investment, financial, or any other type of advice.
Join Cryptos Headlines Community
Follow Cryptos Headlines on Google News
Author