
In the past day, the price of Popcat fell by 13% to reach $0.565, as observed at 02:22 a.m. EST. During this period, trading volume also decreased by 33% to $98 million.
Last week, Popcat emerged as the most traded token on the Phantom wallet, surpassing WIF, MICHI, and SC in terms of swapping activity.
Last week’s top tokens are in…
We got 5 tickers, but only 1 Tooker.
1. POPCAT 🐱
2. WIF 🐶
3. MICHI 🐱
4. SC 🦈🐱
5. TOOKER 🇺🇸👨💼What tokens will come out on top next week? 🤔 pic.twitter.com/HfqOULnruO
— Phantom (@phantom) May 6, 2024
Analyzing Popcat’s Price Movement and Technical Indicators
Popcat has shown significant upward momentum throughout May, witnessing a remarkable 39% surge in the past week and reaching an all-time high of $0.7169 on May 4. Despite this bullish trend, the token has been confined within a falling wedge pattern, with its current price sitting 21% below the ATH.
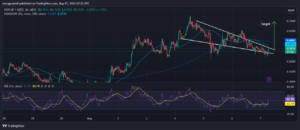
POPCATUSD Chart Analysis Source: Tradingview.com
Bulls supporting Popcat found a foothold around the $0.52 mark, enabling them to elevate the price above the lower boundary of the wedge. Their objective now is to surpass the upper boundary, potentially signaling a breakout to the upside.
Currently, Popcat is trading below both the 50-day and 200-day Simple Moving Averages (SMAs), indicating a prevailing downtrend in the market.
However, the Relative Strength Index (RSI) is showing positive signs, trading above the 50-midline level at 53 and trending upwards. This suggests a growing appetite among investors for buying Popcat tokens. If this bullish sentiment persists, the RSI could potentially reach the 70-overbought region, indicating sustained investor optimism.
Assessing Popcat’s Price Outlook
Popcat’s price analysis reveals a strong bullish momentum, indicating a potential surge beyond the falling wedge pattern. Bulls are eyeing a target of $0.70, with aspirations to surpass the token’s all-time high (ATH) in the long term.
Optimistic investors are buoyed by the bullish signals from both the Relative Strength Index (RSI) and the Simple Moving Averages (SMAs), which could further propel the price upwards.
However, a cautionary note arises as the 50-day SMA crosses below the 200-day SMA, forming a death cross around the $0.60 mark. This bearish signal suggests a potential downturn in the price trajectory. In such a scenario, bulls may seek refuge at the support level near $0.5086 to mitigate downward pressure.
Important: Please note that this article is only meant to provide information and should not be taken as legal, tax, investment, financial, or any other type of advice.
Join Cryptos Headlines Community
Follow Cryptos Headlines on Google News
Author