
Dogecoin (DOGE) on the daily chart has formed an asymmetrical triangle, where buyers are working to keep the price above $0.090, but sellers are pushing it down despite their efforts.
The asymmetrical triangle formation hints at a possible breakout for DOGE. However, before any potential rally, the price of the cryptocurrency might drop. Currently, DOGE is priced at $0.084.
Analyzing DOGE Price Movement
Indicators from the Relative Strength Index (RSI) are hinting at a decline in bullish control over DOGE’s price. If the RSI reading falls below 50.00, there’s a possibility that DOGE could drop to $0.080. However, bullish investors are likely to attempt to push the price higher.
For instance, in case sellers manage to pull down the price, DOGE might decline to $0.0823, aligning with the 0.236 Fibonacci retracement level. If the price bounces back from this point, DOGE could initiate an upward trend towards $0.133, corresponding to the 4.236 Fibonacci retracement level.
Conversely, the bullish outlook may be invalidated if the price falls below $0.080. Such a scenario would indicate increasing bearish dominance amidst heightened selling pressure. In this case, DOGE could descend towards $0.071, potentially hindering any significant relief rally.
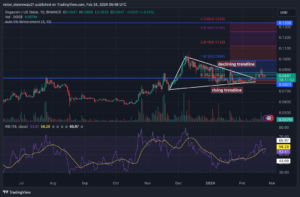
DOGE/USD Daily Chart (Source: TradingView)
Analyst Predicts Massive Breakout for DOGE: Potential Surge to $10
According to analyst Ali Martinez, a recent post on X suggests that Dogecoin (DOGE) may experience a significant breakout beyond the anticipated rise to $0.133. Martinez pointed out a pattern on the weekly chart reminiscent of one observed in 2020.
During that period, Dogecoin’s price surged by a staggering 28,770%. Martinez’s analysis indicates that a potential breakout from the descending triangle pattern could catalyze another bull run for DOGE. Based on the chart shared by Martinez, he suggests that DOGE could potentially approach the $10 mark at some point.
The price action of #Dogecoin is showing familiar patterns reminiscent of its 2020 behavior. Back then, $DOGE broke out from a descending triangle, entered a period of consolidation, and then skyrocketed by 28,770%.
Currently, #DOGE appears to be mirroring this pattern: having… pic.twitter.com/69yXnlYRJd
— Ali (@ali_charts) February 23, 2024
Technical Indicators Hint at DOGE’s Potential Upside
On the 4-hour DOGE/USD chart, the Supertrend indicator revealed a sell signal near $0.089, explaining the struggle for the coin to surpass $0.090. However, the same indicator indicated a buy signal at $0.083.
Traders who purchase DOGE around this level might find profitability if the price rebounds from the lows. Additionally, the Money Flow Index (MFI) surged to $65.30, indicating a notable increase in capital inflow.
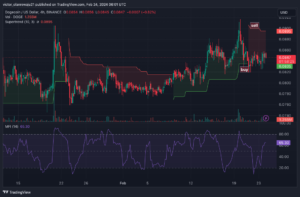
DOGE/USD 4-Hour Chart (Source: TradingView)
This uptick serves as evidence of mounting buying pressure. With continued upward pressure, DOGE’s price may be primed for a significant rally. If the price manages to breach $0.090, DOGE could potentially target $0.13 in the short term.
Important: Please note that this article is only meant to provide information and should not be taken as legal, tax, investment, financial, or any other type of advice.
Join Cryptos Headlines Community
Follow Cryptos Headlines on Google News
Author