After a period of consolidation lasting over a week, meme coins have shown signs of renewed momentum, with top tokens witnessing notable increases in their values.
Specifically, the price of Shiba Inu traded within a narrow range, fluctuating between $0.00000800 and $0.00000860 for a considerable time. Subsequently, a minor pullback occurred, but the bulls demonstrated resilience, leading to a strong rebound in the Shiba Inu price.
Shiba Inu (SHIB) Price Movements and Technical Signals
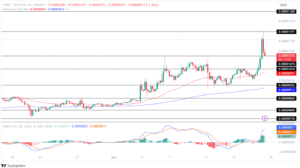
Shiba Inu, a prominent memecoin, traded within a confined range for nearly two weeks before gaining momentum and breaking out, marking a surge of over 24% in its portfolio. However, the bullish run encountered resistance at $0.00001074.

TradingView: SHIB/USDT
Following the rejection, the price entered another consolidated range, oscillating between $0.00000926 and $0.00001074 for a brief period.
More recently, the bulls regained strength, successfully breaking the resistance at $0.00001074. However, the upward momentum was short-lived as the price faced rejection at $0.00001197, leading to a loss of bullish momentum.
Examining the technical indicators, the Moving Average Convergence Divergence (MACD) reveals a substantial rise in the histogram, indicating an intensified buying pressure for Shiba Inu in the market. Additionally, the averages show a sharp ascent, suggesting a continued uptrend in the coin’s value in the coming days. These technical signals provide insights into the dynamic movements and potential future trends of Shiba Inu’s price.
Shiba Inu (SHIB) Price Outlook: Testing Support and Resistance Levels
The future trajectory of Shiba Inu’s (SHIB) price hinges on critical support and resistance levels. Should the bulls successfully maintain the price above the support level of $0.00001076, it is likely to regain momentum, setting the stage for a potential test of the resistance level at $0.00001197.
Sustaining the price at this higher level would pave the way for SHIB to aim for its upper resistance level of $0.0000130 in the upcoming week.
Conversely, a failure to hold above the support level could result in a loss of momentum, leading to a descent and a test of the lower support level at $0.00001010. In a scenario where bearish conditions persist, a further decline could prompt a critical test of the support level at $0.00000926. Investors will closely monitor these key levels for indications of potential market trends in the short term.
Important: Please note that this article is only meant to provide information and should not be taken as legal, tax, investment, financial, or any other type of advice.
Join Cryptos Headlines Community
Follow Cryptos Headlines on Google News


