and Ripple (XRP) Will Stay Stuck in December 2024 While RCOF Completes 8000x Run")
Solana is showing strength by staying above the support level of $67.50 and has initiated a new upward trend. The price of SOL is picking up momentum and is likely to make an effort to surpass the $80 mark soon.
The SOL price has initiated a new rally, surpassing the $72 resistance level against the US Dollar. Currently, it is trading above $74 and has crossed the 100 simple moving average (4 hours). Examining the 4-hour chart of the SOL/USD pair (data sourced from Kraken), a significant bullish trend line is taking shape with support around $70.00. The pair has experienced an impressive 8% increase and shows potential for further rallying beyond the $80 resistance zone.
Solana’s Recent Performance and Potential Upside Movement
In the recent days, Solana, much like Bitcoin and Ethereum, underwent a corrective downturn from the $80.00 zone. This led to SOL slipping beneath the $77.50 and $75.00 support levels.
Despite this, bullish activity prevailed above the $67.50 support, forming a low around $67.25. Presently, there’s an effort to instigate a fresh upward movement, marked by a climb above the $70 and $72 resistance levels. Notably, SOL has surged nearly 8%, breaching the 50% Fib retracement level from the $79.45 swing high to the $67.25 low.
As of now, SOL is trading beyond $74 and above the 100 simple moving average (4 hours). The 4-hour chart for the SOL/USD pair reveals a significant bullish trend line with support at approximately $70.00.
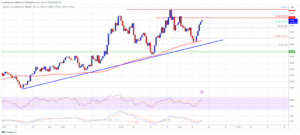
Source: SOLUSD on TradingView.com
Looking at potential obstacles on the upside, the immediate resistance rests around $76.50, close to the 76.4% key bullish trend line. Beyond this, the first major hurdle is near $80.00, with the primary resistance at $82.0. A successful close above this level might pave the way for a substantial rally, with the next key resistance at $88.00. Further gains could propel the price towards the $92.00 level. Solana’s performance remains dynamic, with attention on key resistance levels for potential upward movements.
Solana’s Potential Downside Scenarios and Key Technical Indicators
If SOL encounters difficulty surpassing the $80.00 resistance, there’s a possibility of a fresh decline. The initial support on the downside is expected around the $72.00 level.
The first major support comes into play near the $70.00 level or the identified trend line. Dropping below this, the price may test the $67.50 support. A close below $67.50 could lead to a decline towards the $65.00 support in the short term.
Technical Indicators:
4-Hours MACD: The MACD for SOL/USD is exhibiting bullish momentum in the current zone.
4-Hours RSI (Relative Strength Index): The RSI for SOL/USD is positioned above the 50 level, indicating a positive stance.
Key Support Levels: $72.00, and $70.00.
Key Resistance Levels: $76.50, $80.00, and $88.00.
As Solana faces the challenge of breaching key resistance, monitoring these support and resistance levels along with the MACD and RSI indicators will provide insights into potential market movements.
Important: Please note that this article is only meant to provide information and should not be taken as legal, tax, investment, financial, or any other type of advice.
Join Cryptos Headlines Community
Follow Cryptos Headlines on Google News