SOL’s price is up from $54, offering a DCA opportunity for bulls. A breakout from a falling wedge pattern is anticipated, targeting $66.
Solana’s price prediction faces challenges as the smart contracts token, like many altcoins, is affected by selling pressure and Bitcoin’s rising dominance at 51.3%. Recent optimism took a hit due to developments at Binance, the largest exchange.
Binance’s Former CEO Resigns Amidst $4.3 Billion Settlement
In the wake of Binance’s $4.3 billion settlement with the US Department of Justice (DoJ), former CEO Changpeng Zhao (CZ) resigned and admitted guilt in violating US anti-money laundering rules. Richard Teng steps in as the new CEO.
Although CZ retains his stake, he relinquishes all executive roles. This development, coupled with market uncertainty, led to a Solana price correction, testing the $54 support. If the support holds and a rebound occurs, there’s potential for a significant SOL breakout.
Solana Price Analysis: Consolidation and Potential Breakout
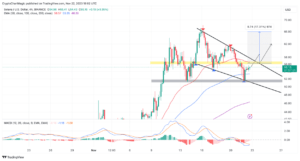
Solana is currently finding support at $54, situated between the 100 Exponential Moving Average (EMA) (blue) and the 50 EMA (red). The price is expected to consolidate in this range, and breaching the $56.58 resistance could trigger a 17% breakout to $66.

Solana price prediction weekly chart | Tradingview
The presence of a falling wedge, a bullish pattern, suggests a period of consolidation before an uptrend resumes. Additionally, the Moving Average Convergence Divergence (MACD) indicator is on the verge of a buy signal, indicating a potential long opportunity for traders.
Some traders, such as @CryptoBusy, see profit opportunities in Solana and advise Dollar-Cost Averaging (DCA) as long as the $54 support holds. A recovery above $60 to $70 is plausible, with gains beyond $70 considered a bonus.
$SOL trade quick take profit has been activated! ✅
Shared this 24 hours ago. 💰
Looks like the market just wants us to profit, then it bounces back up from the support!
Follow us @CryptoBusy for more content like this!#Bitcoin #Solana https://t.co/A7tWMSDvGL pic.twitter.com/jpwbpK6wj1
— CryptoBusy (@CryptoBusy) November 22, 2023
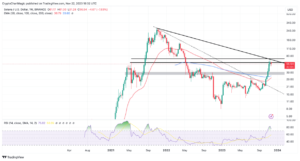
However, the Relative Strength Index (RSI) poses a potential bearish signal, particularly on the weekly chart, with an RSI strength of 73 (down from highs around 83).

Solana price prediction weekly chart | Tradingview
If the pullback persists, Solana may face a consolidation phase, finding support at $50.
Important: Please note that this article is only meant to provide information and should not be taken as legal, tax, investment, financial, or any other type of advice.
Join Cryptos Headlines Community
Follow Cryptos Headlines on Google News


