The Terra Classic price seems set for a positive turnaround as a flag pattern has formed. This pattern suggests that the LUNC price might start moving upward in a bullish direction, indicating a potential recovery.
Over the past two weeks, the Terra Classic coin went through a noticeable drop, falling from $0.000079 to its current value of $0.0000723, reflecting a significant 25% decrease. This decline intensified on November 21, influenced by the wider cryptocurrency market’s negative response to the news of Binance CEO Changpeng Zhao resigning due to allegations of breaking U.S. anti-money laundering laws. Despite these challenges, the LUNC price’s movement within a falling wedge pattern hints at the possibility of a positive comeback.
Terra Classic Price Outlook: $LUNC Aiming for $0.00008
A flag pattern is shaping up, and it could lead to a recovery rally pushing the LUNC price to a range between $0.000079 and $0.00008. The lower trendline of this flag pattern acts as a safeguard, preventing a significant drop for LUNC. Additionally, the intraday trading volume for the LUNC coin stands at $35.5 million, signaling a substantial 47% gain.
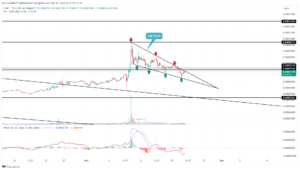
Source- Tradingview
The recent dip in LUNC’s price follows a notable climb from mid-October to early November, indicating the formation of a bullish flag pattern. This pattern suggests that the recent downturn might just be a temporary setback before a more significant recovery.
In the last couple of weeks, the coin’s price consistently rebounded from the lower trendline of this pattern, emphasizing its impact on market sentiment. Currently trading at $0.0000726, the Terra Classic coin seems to be bouncing back again from the upper trendline.
The narrowing wedge pattern hints at an upcoming breakout, with a good chance of surpassing the upper trendline. This breakout could establish a strong support level, sustaining the positive momentum.
If this breakout occurs, we might see a potential uptick of around 32%, possibly reaching the previous high of $0.000079.
LUNC Coin Price Analysis: Comparing Behavior with Bitcoin
Examining the three-month performance of LUNC Coin alongside Bitcoin highlights their joint gains during the October-November rally. However, with ongoing market uncertainty, LUNC has experienced a notable decline, signaling a weakening of bullish strength, particularly when compared to the more stable Bitcoin price.
Technical Indicators
Bollinger Bands: The lower boundary of the Bollinger Band indicator’s downturn reflects the prevailing selling momentum.
Moving Average Convergence Divergence (MACD): Both the MACD and signal slope below the middle line suggest that sellers currently hold an advantage over the asset.
Important: Please note that this article is only meant to provide information and should not be taken as legal, tax, investment, financial, or any other type of advice.
Join Cryptos Headlines Community
Follow Cryptos Headlines on Google News
Author