
Solana’s price is increasing strongly above $110, indicating bullish momentum. The price of SOL is rising, and it’s possible that the bulls will target a move above the $120 level soon.
SOL’s price began rising again from the $95.00 support against the US Dollar. It’s now above $105 and the 100 simple moving average on the 4-hour chart. A bullish trend line is forming with support at $109.20. If it surpasses resistance levels at $115 and $118, the pair may continue its rally.
Solana Price Surge and Potential Resistance Ahead
Solana’s price has established a base above the $94.00 support zone and has initiated a fresh upward movement. Notably, it has surged by almost 10%, surpassing both the $110 level and outperforming Bitcoin and Ethereum. The bullish momentum led the price to approach $115, reaching a high near $114.98, with no signs of a slowdown in the upward trend.
Currently, the price is maintaining its gains above the 23.6% Fibonacci retracement level of the recent wave from the $103.38 swing low to the $114.98 high. Moreover, Solana is trading above $110 and the 100 simple moving average on the 4-hour chart, indicating continued bullish sentiment.
A key bullish trend line is forming with support at $109.20 on the 4-hour chart of the SOL/USD pair, aligning closely with the 50% Fibonacci retracement level of the recent wave.
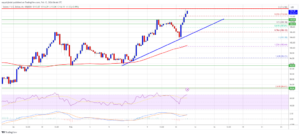
Source: SOLUSD on TradingView.com
Looking ahead, immediate resistance lies near the $115 level, with the next major resistance zone near $118. A successful breakthrough above $118 could pave the way for another significant uptick. Further resistance awaits near the $125 level, while continued gains might propel the price towards the $132 mark.
Solana’s Potential Downside and Key Support Levels
If Solana (SOL) fails to break above the $115 resistance level, it might trigger a downside correction. The initial support on the downside is anticipated near the $112.20 level.
Further down, the first major support zone lies around the $109.20 level, aligned with the established trend line. A breach below this level could lead the price to test the $105 support. Should the price close below $105, it could potentially decline towards the $100 support in the short term.
Technical Indicators: In terms of technical indicators, the 4-hour Moving Average Convergence Divergence (MACD) for SOL/USD is gaining momentum in the bullish zone. Additionally, the 4-hour Relative Strength Index (RSI) for SOL/USD is above the 50 level, suggesting a bullish sentiment.
Key Support and Resistance Levels: Major support levels to watch for include $102.20 and $109.20, while significant resistance levels stand at $115, $118, and $125.
Important: Please note that this article is only meant to provide information and should not be taken as legal, tax, investment, financial, or any other type of advice.
Join Cryptos Headlines Community
Follow Cryptos Headlines on Google News
Author