The creation of a double top pattern during a general market decline suggests that the price of Solana could continue to drop further.
In the current market downturn, Solana, a layer 1 cryptocurrency, is having difficulty maintaining its position above $205. It has faced rejection twice in three weeks, forming a double-top pattern. This pattern, appearing after a long period of price increases, indicates that SOL holders could experience a notable correction in the near future.
Solana (SOL) Price Analysis: Recent Trends and Liquidations
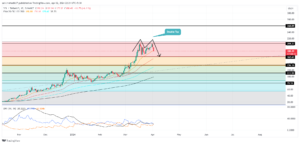
Solana Price| Tradingview
Since late January, Solana (SOL) has skyrocketed by 166%, hitting a high of $210, the highest in 27 months. However, the momentum slowed down as it struggled to surpass this resistance level due to market consolidation.
On April 1st, SOL faced its second reversal from the $205 resistance, leading to a 12% drop to $179.8. This decline resulted in the liquidation of $20 million worth of Long positions, according to Coinglass, a derivative market tracker.
Solana (SOL) Weekly Chart Analysis: Potential Bullish Reversal
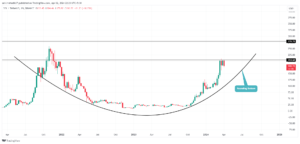
Solana Price| Tradingview
Looking at the weekly chart, it’s clear that SOL is forming a substantial rounding bottom pattern, which is known as a strong indicator of a trend reversal. This pattern suggests that the downward trend is coming to an end and could mark the start of a new upward trend.
With consistent buying pressure, SOL has the potential to surge up to $260. This target aligns with the strength of the rounding bottom pattern, indicating significant buying support.
Key Technical Indicators
- Exponential Moving Average (EMA): The 20-day and 50-day EMA slopes are crucial support levels for buyers during market corrections, providing key pullback zones.
- Directional Movement Index (DMI): The DI+ (blue) and DI- (orange) slopes are showing signs of a potential bearish crossover, indicating the development of a corrective trend in this altcoin.
Important: Please note that this article is only meant to provide information and should not be taken as legal, tax, investment, financial, or any other type of advice.
Join Cryptos Headlines Community
Follow Cryptos Headlines on Google News
Author