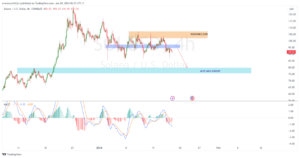
Solana’s price is currently exhibiting a bearish trend, and analysts foresee the possibility of a dip to $60 due to increased market volatility and uncertainty.
Solana’s recent price movement has experienced a slight decline, dropping over 3% to $91.93 amid bearish market influences. Analysts speculate that this minor dip could contribute to expectations of a potential further decrease in price.
Solana (SOL) Market Overview: Trading Trends and Dynamics
Solana (SOL) currently holds the fifth position among cryptocurrencies with a market valuation of around $39 billion, as per CoinMarketCap. The 24-hour trading volume has contracted by over 3%, reaching $2.4 billion, indicating increased seller interest.

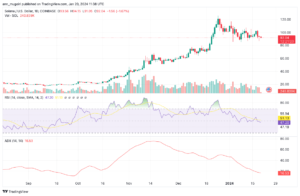
Source: TradingView
In the recent week, Solana’s price has seen fluctuations between $100 and $91, characterized by lateral trading dynamics and converging trendlines. While there’s been a marginal 0.78% weekly drop, the monthly performance reveals an 18% increase in SOL’s value.
December 2023 witnessed a robust surge in Solana’s price, surpassing $121 and marking the yearly peak. Despite this climb, a gradual descent to the $90 range has been observed recently, reflecting an ongoing battle for market dominance between bears and bulls.
Solana (SOL) Price Prediction: Analyst Forecasts and Market Dynamics
Crypto analyst Toni Ghinea predicts a significant downturn for Solana, anticipating a drop to around $60 by late 2024. This projection challenges the current understanding of Solana’s market behavior, highlighting the inherent unpredictability of digital currencies.
The current market dynamics for Solana (SOL) reveal high volatility and uncertainty, with increasing bearish pressure raising speculation of SOL approaching the $80 mark. Analysts closely monitor these movements, considering the potential for a further decline to a critical $60 level if bearish dominance persists.
On the flip side, a shift in market sentiment could initiate an upward trend for SOL. Buyers entering with substantial momentum might break through the $110 resistance level, allowing SOL to retest its previous high of around $121. The outcome depends on the strength and consistency of buying pressure, making the upcoming days crucial for Solana’s trajectory.

Solana price chart: Tradingview
Daily technical analysis presents a potentially bearish picture for Solana in the near term. Indicators like moving averages and oscillators are neutral, reflecting prevailing market uncertainty. The Relative Strength Index (RSI) at 47 could lean towards oversold conditions in an anticipated bearish trend. The Average Directional Index (ADX) at 28 aligns with a bearish forecast, and both the 20-EMA and 50 Exponential Moving Averages are trending negatively, supporting the possibility of a bearish phase for SOL.
Important: Please note that this article is only meant to provide information and should not be taken as legal, tax, investment, financial, or any other type of advice.
Join Cryptos Headlines Community
Follow Cryptos Headlines on Google News


