Solana, represented by SOL, has made a strong comeback in terms of price, but it’s been facing a general downward trend. The recent movement saw the price go from $17.3 to $20.54, giving those in favor an 18% profit. However, going beyond the $20 mark might prove to be a bit challenging.
Looking at the daily chart, Solana’s price movement has been forming a descending channel since July. On September 11, there was a recovery that started from the lowest point of the channel at $17, and it went up a bit, pausing around the higher range.
As of now, there’s a pullback happening within a 12-hour bullish order block (OB) that spans from $18.3 to $19.5 (shown in white). This pullback might find support around the middle of this OB, and it could lead to a price reversal. However, this also depends on how Bitcoin (BTC) performs in the medium term. So, for potential buyers, it’s essential to keep an eye on key levels like $16, $17.75, and the middle range at $18 as they could play a significant role.
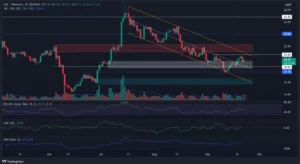
The $20 mark is a tough one for Solana because it’s a convergence point for various resistance levels. As of now, Solana hasn’t managed to go past $20.60, and on the daily chart, the market structure has turned bearish. There’s a bearish indicator called an OB (Order Block) above the high point from December, and this could make it challenging to break past $20 unless Bitcoin (BTC) also makes a recovery.
Looking at indicators like the OBV (On-Balance Volume), it seems that the demand in the spot market has influenced the recent recovery. However, when we check the CMF (Chaikin Money Flow) and RSI (Relative Strength Index), they appear to have hit certain important levels and stalled. This suggests a decrease in buying pressure and the flow of funds into Solana.
What Lies Ahead for Solana?
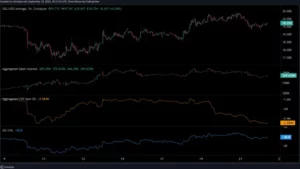
The market seems to be under the control of sellers for a while now, as shown by the Cumulative Volume Delta (CVD), which reflects the overall trading volume. Moreover, the Open Interest rate has also gone down, suggesting a slight dip in demand.
Adding to this, the negative Accumulation Swing Index (ASI) tells us that Solana’s price trend is on a downward path for the long term. ASI basically measures the power behind price changes, and when it’s negative like this, it means sellers are getting stronger, especially on charts that cover longer timeframes.
Important: Please note that this article is only meant to provide information and should not be taken as legal, tax, investment, financial, or any other type of advice.
Join Cryptos Headlines Community
Follow Cryptos Headlines on Google News
Author