


Despite a recent 13% decline due to market downturns, Solana (SOL) is poised for a significant recovery. Market analyst Ali Martinez believes SOL could rebound strongly, potentially reaching $280.
Martinez highlighted a bullish breakout pattern forming on Solana’s chart, indicating favorable conditions for a price surge in the near term.
Solana (SOL) Analysis by Analyst Ali Martinez
Market analyst Ali Martinez has identified crucial support and resistance levels for Solana (SOL) at $143 and $178, respectively. These levels are pivotal in determining whether SOL will experience a strong upward movement or a potential downturn.
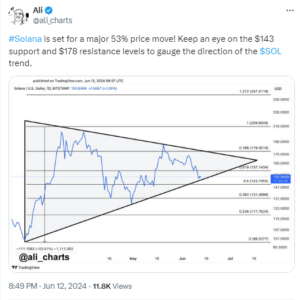
Courtesy by Ali. Source: X
Martinez’s analysis includes a chart showing Solana’s candlestick patterns forming a symmetrical triangle over the past two months. This pattern is typically viewed as a bullish signal, suggesting a potential breakout in SOL’s price.
The symmetrical triangle formation began in mid-March 2024 when Solana surged from around $101 to nearly $210. Despite multiple attempts, SOL faced resistance at the $210 level and retraced to find support around $141, which coincided with the 0.382 Fibonacci level.
After finding support, Solana rallied again, encountering resistance near the 0.786 Fibonacci level at $185. By early June 2024, SOL retraced to $157 from this level.
Currently, Solana is trading around $150.95, just above the 0.5 Fibonacci level at $143. This level is critical as it aligns with the lower boundary of the symmetrical triangle, indicating a significant decision point for Solana’s price movement in the near future.
Solana (SOL) Price Outlook: Key Levels and Potential Movements
Analyst Ali Martinez suggests that the resolution of Solana’s symmetrical triangle pattern could lead to a significant 53% price movement. Currently, if SOL manages to maintain support above $143, it could indicate a potential rally towards the resistance level at $178. Breaking through this critical zone would likely confirm Martinez’s bullish projection, potentially pushing SOL towards the $280 mark.
However, a downturn below the crucial support level of $143 might signal further declines. In such a scenario, deeper Fibonacci levels could become relevant, possibly targeting the $67 region. This makes the current support level a pivotal area to watch for determining Solana’s short-term price direction.
Solana (SOL) Technical Indicators Analysis
On the daily chart, the Relative Strength Index (RSI) for Solana (SOL) is currently at 41.50, approaching the oversold region typically observed below 35. This suggests that SOL may be nearing a potential buying opportunity, particularly around the critical support level of $143. If buying interest increases at this level, it could prompt a rebound in SOL’s price towards the resistance at $178.
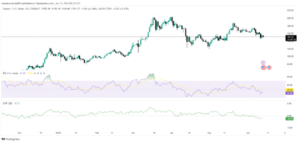
Solana Chart TradingView
In contrast, the Chaikin Money Flow Index (CMF) is trending below the zero line, currently at -0.13. This indicates a decline in the inflow of money into the Solana market, suggesting diminishing buying pressure. This downward trend in the CMF could contribute to further downward pressure on SOL’s token price unless buying activity picks up to support higher price levels.
Important: Please note that this article is only meant to provide information and should not be taken as legal, tax, investment, financial, or any other type of advice.
Join Cryptos Headlines Community
Follow Cryptos Headlines on Google News
Author