In today’s cryptocurrency market, the ongoing correction seems to pause as Bitcoin makes an effort to maintain a position above $42,000. The key question is whether the recovery will continue.
In today’s cryptocurrency landscape, there’s a slight relief in the ongoing correction as Bitcoin attempts to stabilize above $42,000. Despite the introduction of spot Bitcoin ETFs not causing a significant surge in BTC, technical chart analyses indicate that the current correction is a common pattern seen in financial assets, often preceding a return to bullish momentum.
Altcoin Market Breaks Out of Wyckoff Accumulation Phase
Renowned crypto analyst @thescalingpro recently shared a significant development in the altcoin sector. According to the analyst, the #Altcoin Marketcap has successfully broken out of the massive Wyckoff Accumulation phase, with the price currently consolidating above the breakout point. This development has sparked anticipation of an impending altcoin rally.
#Altcoin Marketcap Broke out of the Massive Wyckoff Accumulation phase.
Price is currently consolidating above the point of breakout. Altcoin Rally Incoming 🤝 pic.twitter.com/wgTGzp4WxF
— Mags (@thescalpingpro) January 15, 2024
The approval of Spot Bitcoin ETFs has played a role in boosting confidence in the cryptocurrency market, and now, there is a growing expectation for the approval of Ethereum ETFs. Analysts believe that this potential approval will further increase buying pressure in the altcoin market, signaling positive momentum ahead.
Today’s top cryptocurrency picks:
Ethereum (ETH) Price Analysis Amid Market Fluctuations
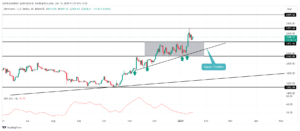
The recent approval of the Spot Bitcoin ETF had a more significant impact on Ethereum (ETH) than Bitcoin, resulting in a notable 10.4% surge on Wednesday. This breakthrough lifted ETH beyond the key resistance level of $2,430, reaching a two-year peak at $2,700 last week. However, this peak was short-lived as the broader market entered a correction phase.

Klaytn (KLAY) Price| TradingView Chart
Over the past five days, Ethereum’s price has experienced a 6.5% decline, currently hovering around $2,530. The downward trend is expected to revisit the $2,430 mark, acting as a potential support level.
Should ETH successfully maintain itself above the critical $2,430 support, it might trigger a resurgence, potentially rallying toward $2,700 and aiming for the $3,000 milestone.
Analyzing the daily time frame chart, Ethereum’s recovery path appears guided by an ascending trendline, providing dynamic support for buyers. As long as this trendline remains intact, ETH’s upward momentum could persist.
Furthermore, the ADX indicator, standing at 20%, indicates that the ongoing buying momentum possesses the strength to propel the cryptocurrency to higher levels.
Klaytn (KLAY) Price Analysis: Potential 62% Surge
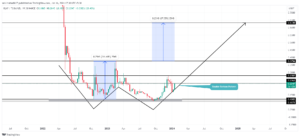
During the launch week of the Spot Bitcoin ETF, Klaytn’s native token, KLAY, exhibited notable stability, consistently maintaining levels above $1.6. This strong support paved the way for a bullish reversal, driving the altcoin’s value up by an impressive 52% within two weeks, currently trading at $0.23.

Klaytn (KLAY) Price| TradingView Chart
A significant portion of this recovery is reflected in the latest data, showing a 21.5% increase in KLAY’s price over the last 24 hours. This surge is likely attributed to market enthusiasm surrounding the recent merger announcement with Finschia Foundation, aiming to establish a dominant Web3 technological hub and ecosystem across Asia.
The joint ecosystem is anticipated to include over 420 decentralized applications (DApps) and a remarkable 250 million wallets. Integration with Kakaotalk and LINE, two widely used messaging services in Asia, further enhances the ecosystem’s reach.
This positive development aligns with a bullish double-bottom chart pattern in the technical analysis, indicating robust growth potential for Klaytn. If this pattern holds, the KLAY price may witness a 62% surge, challenging the neckline resistance at approximately $0.376.
A successful breakout beyond this resistance level would provide a more solid confirmation of a trend reversal.
Chiliz (CHZ) Price Analysis: Rally to $0.135
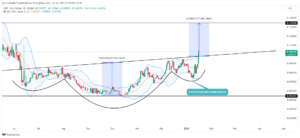
Examining the daily time frame chart reveals a notable development in Chiliz’s seven-month sideways trend, forming an inverted head and shoulder pattern. This widely recognized bullish reversal pattern, often signaling a trend reversal at market bottoms, indicates positive momentum for Chiliz.

Chiliz (CHZ) Price| TradingView Chart
Over the past three months, Chiliz has been in recovery mode, witnessing a substantial growth of 93.6% from $0.054 to its current trading price of $0.105. During this rally, the coin experienced a decisive breakout from the neckline resistance at approximately $0.098.
For the potential continuation of this bullish trend, it is crucial for the coin’s price to sustain above the breached trendline. If successful, buyers may drive a significant 28% rally, targeting the $0.135 mark.
The upper boundary of the Bollinger band indicator suggests an uptick, indicating current dominance by buyers in this asset. This bullish pattern and favorable technical indicators contribute to the positive outlook for Chiliz’s price.
Important: Please note that this article is only meant to provide information and should not be taken as legal, tax, investment, financial, or any other type of advice.
Join Cryptos Headlines Community
Follow Cryptos Headlines on Google News


