Over the last week, the price of TRON (TRX) has gone up by more than 8.0%, starting from $0.11 and reaching its current price. Currently, its highest ever price has been $0.23.
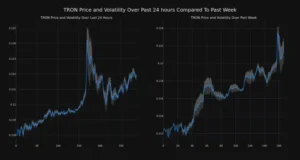
The chart below shows how the price of TRON has been changing and how much it’s been going up and down in the last 24 hours on the left side, and on the right side, it compares the price changes over the past week.

Tron Price and Volatility Chart
Bollinger Bands and Volatility
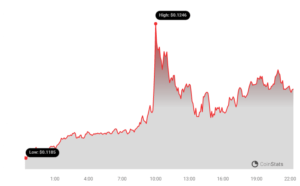
In the last 24 hours, the price of TRON (TRX) has gone up by 3.29% to reach $0.12.

Tron Price Chart | Source: Coinstats
The gray bands seen in the chart represent Bollinger Bands, which gauge the volatility in both daily and weekly price movements. When these bands widen or the gray area increases, it indicates higher volatility in the market.
Trading Volume and Circulating Supply
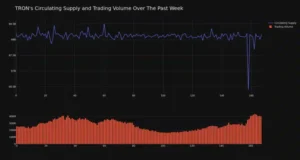
Over the past week, the trading volume for TRON has surged by 56.0%. Interestingly, this movement has been in the opposite direction compared to the overall circulating supply of the coin, which has slightly decreased by 0.05%. The current circulating supply stands at 88.10 billion TRX.

Tron Circulating Supply and Trading Volume
According to our data, TRON is currently ranked #13 in terms of market capitalization, with a value of $10.73 billion.
Important: Please note that this article is only meant to provide information and should not be taken as legal, tax, investment, financial, or any other type of advice.
Join Cryptos Headlines Community
Follow Cryptos Headlines on Google News


