The overall crypto market cap, represented by TOTALCAP, has been on the rise since September 11. However, it hasn’t managed to break through its downward resistance trendline. On the other hand, Bitcoin (BTC) faced rejection from its own descending resistance line on September 11, resulting in a notable upper wick.
As for eCash (XEC), it did manage to break out from its descending resistance line. Unfortunately, it couldn’t overcome a significant horizontal resistance zone, leading to the formation of a long upper wick in its price chart.
The total crypto market cap (TOTALCAP) and the price of Bitcoin (BTC) both saw increases that brought them close to their descending resistance lines, but they didn’t manage to break through. Meanwhile, eCash (XEC) successfully broke out from its own descending resistance line.
In another development, the bankrupt cryptocurrency exchange FTX has filed a lawsuit against the parents of Sam Bankman-Fried, seeking to recover millions of dollars that they claim were fraudulently misappropriated.
TOTALCAP Crypto Market Cap Attempts Resistance Line Breakout
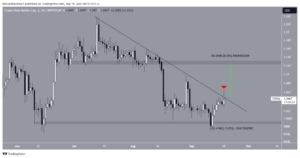
The TOTALCAP, representing the overall crypto market cap, had been following a descending resistance line since July 13. This downward trend led to a low point of $978 billion on September 11.
Following this low, TOTALCAP started moving upward and reached the resistance line on September 18. However, it couldn’t break through the resistance and, instead, formed a long upper wick (marked in red).

TOTALCAP Daily Chart. Source: TradingView
If the price manages to break out, it could potentially increase by 8% and reach the resistance level at $1.13 trillion. However, if it gets rejected, there’s a higher probability of a 5% drop, bringing it down to around $995 billion.
BTC Price Reaches Resistance Line
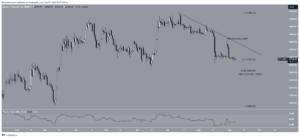
Bitcoin’s price had been following a descending resistance line since July 13, which pushed it down to a low of $24,901 by September 11. Afterward, the price made a significant rebound, reaching as high as $27,409 on September 18.
However, Bitcoin couldn’t break through the descending resistance line. Instead, it formed a long upper wick (red icon) and experienced a slight decline. A breakout from this line would signal that the correction is over.

BTC/USDT Daily Chart. Source: TradingView
If Bitcoin manages to break through the resistance line, its price could surge by 9% and reach the $29,200 resistance level. On the other hand, if it faces rejection, there’s a higher likelihood of a 5% decline, bringing it down to the $25,400 support area.
eCash (XEC) Overcomes Descending Resistance Line
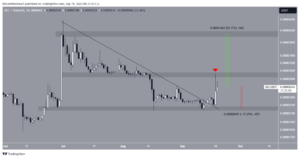
The price of XEC has been rising since August 17. It made a higher low on September 11 and successfully broke through a descending resistance line three days later. On September 18, it reached a high of $0.000029.
Breaking through the resistance line suggests that the previous price correction has concluded, and a new upward trend may be underway. However, XEC’s price couldn’t surpass the $0.000029 resistance level, resulting in a notable upper wick and a subsequent decline.

XEC/USDT Daily Chart. Source: TradingView
If XEC manages to break out, it could potentially reach the next resistance level at $0.000041, which is about 55% higher than its current price. However, if the price starts falling again, it might decline to the $0.000021 support area, representing a 17% drop from its current value.
Important: Please note that this article is only meant to provide information and should not be taken as legal, tax, investment, financial, or any other type of advice.
Join Cryptos Headlines Community
Follow Cryptos Headlines on Google News


