This week, the crypto market experienced a lot of ups and downs due to uncertainty about the Spot Bitcoin ETF. On October 16, most major cryptocurrencies saw a surge in buying, but it didn’t last. XRP, the 5th largest cryptocurrency, attempted to break the $0.5 mark but faced strong selling pressure.
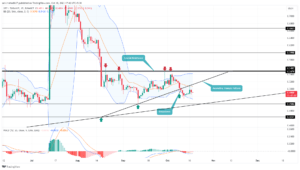
XRP faced selling pressure at $0.5. If it breaks below the triangle pattern, it suggests sellers might continue the correction trend. The intraday trading volume for XRP was $619 million, marking a 13% decrease.

Source: Tradingview
XRP’s price has faced strong bearish pressure in October, dropping from $0.548 to $0.489, marking an 11.2% decline. This drop broke through a bullish pattern called an ascending triangle and indicated significant bearish momentum.
On October 16, XRP failed to reclaim the $0.50 level, showing continued selling pressure. An attempt to test the new resistance level encountered rejection, indicating that bears currently dominate the market.
If sellers break below the retest candle’s low at $0.485, XRP could potentially decline by another 6.5% to reach the combined support level at $0.458 and a longer-term trendline.
When comparing Bitcoin and XRP’s performance in 2023, both showed upward trends. Bitcoin had a steady rally, while XRP exhibited higher volatility and came closer to its recent low of $0.45. This suggests that confidence among XRP buyers is waning.
Analyzing using technical indicators
Bollinger Bands: The lower band of the Bollinger Band indicator moving lower indicates strong bearish momentum.
Moving Average Convergence Divergence (MACD): A bearish crossover between the MACD blue and signal orange lines indicates an ongoing downward trend.
Important: Please note that this article is only meant to provide information and should not be taken as legal, tax, investment, financial, or any other type of advice.
Join Cryptos Headlines Community
Follow Cryptos Headlines on Google News


