The price of XRP is making a new attempt to rise from $0.4730 against the US Dollar. If it can avoid dropping below $0.4880, there’s a chance it might reach around $0.5320.
XRP is finding it tough to break past the $0.5065 barrier against the US dollar. Currently, it’s trading below $0.500 and the 100 simple moving average over a four-hour period. However, there was a positive development as it broke a significant bearish trend line with resistance at about $0.4915 on the XRP/USD chart. But there’s a risk that it could move lower if it breaches the support area at $0.4880.
XRP Price Looks to Bounce Back
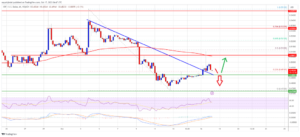
XRP experienced a gradual drop and eventually found support around $0.4730, a pattern similar to what Bitcoin and Ethereum went through. It then began a recovery, surpassing the $0.4880 barrier.
The bulls managed to push the price beyond the 23.6% Fibonacci retracement level, which measures the main drop from the $0.5510 high to the $0.4730 low. Additionally, there was a significant development as the price broke through a major bearish trend line with resistance around $0.4915 on the XRP/USD chart.
However, the bears remained quite active just above the $0.500 resistance zone. Currently, the price is trading below $0.500 and under the influence of the 100 simple moving average spanning four hours.
Looking ahead, the immediate hurdle is around the $0.500 mark. The primary resistance comes in at approximately $0.5065, which coincides with the 100 simple moving average for four hours, or the 50% Fibonacci retracement level of the major drop from the $0.5510 high to the $0.4730 low.

Source: XRPUSD on TradingView.com
If the price can successfully break above the $0.5065 level, it may head towards the $0.521 resistance. A strong move beyond this level could potentially trigger a significant uptrend towards the $0.550 resistance. Further gains might propel XRP towards the $0.585 resistance.
Possible Further Losses?
If XRP can’t break through the resistance zone at $0.5065, it might continue moving in a downward direction. The initial support in this scenario would be around $0.488.
The next significant support level to watch is at $0.4730. If the price experiences a decline and manages to close below the $0.4730 mark, XRP’s value could drop even further. In such a situation, there’s a chance that the price might test the support zone at $0.4320.
Technical indicators also give us some insights. The 4-hour MACD for XRP/USD is showing a slowdown in the bullish zone, while the 4-hour RSI (Relative Strength Index) for XRP/USD is currently above the 50 level.
In terms of major levels, we’re looking at support levels at $0.488, $0.473, and $0.432. On the flip side, resistance levels to consider are $0.5065, $0.5210, and $0.550.
Important: Please note that this article is only meant to provide information and should not be taken as legal, tax, investment, financial, or any other type of advice.
Join Cryptos Headlines Community
Follow Cryptos Headlines on Google News


