Polkadot’s (DOT) value suffered a setback on January 2 amidst a market downturn triggered by the Matrixport report. Experiencing a notable 20% decline in just a few hours due to substantial altcoin liquidations, the looming question is whether there’s potential for a DOT price surge in 2024.
Currently, the price of Polkadot (DOT) is $6.92, with a trading volume of $617.26 million in the last 24 hours. The market cap for Polkadot is $6.83 billion, and it holds a market dominance of 0.41%. Over the past 24 hours, the DOT price has seen a decline of -3.93%.
Polkadot Price History and Trends
Polkadot (DOT) reached its peak on November 4, 2021, hitting an all-time high of $54.98. On the flip side, it recorded its lowest price on August 22, 2020, dropping to an all-time low of $2.82. Following the peak, the subsequent cycle saw a low of $3.59 (cycle low) and a high of $9.59 (cycle high). The current market sentiment for Polkadot’s price prediction is leaning towards a bearish outlook, with the Fear & Greed Index indicating a level of 71, signifying greed in the market.
Presently, Polkadot’s circulating supply is 987.58 million DOT out of a maximum supply of 1.00 billion DOT. Within the Proof-of-Stake Coins sector, Polkadot holds the 7th rank, while in the Layer 1 sector, it is positioned at the 11th rank based on market cap.
Polkadot Parachains and Challenges
Polkadot’s parachains function as advanced plug-in crypto networks that enhance the capabilities of the primary Polkadot network. The initiation, financing, and development of these parachains follow a meticulously organized process through parachain auctions, culminating in well-timed launches according to a predefined schedule.
Unfortunately, certain parachain auctions in 2022 faced delays in their launches or encountered challenges in securing adequate funding. This perceived fragility in execution has raised concerns among investors about Polkadot’s intrinsic value.
Performance and Market Trends
Over the past year, Polkadot has exhibited a performance lag behind 51% of the top 100 cryptocurrencies, indicating a comparative underperformance within the broader market. Notably, it has been surpassed by major players like Bitcoin and Ethereum during this period. Additionally, in the last 30 days, Polkadot has seen only 14 days of positive price movement, constituting 47% of the observed period.
Furthermore, the current price reflects a significant 87% decline from its all-time high, indicating a substantial retracement. These metrics highlight the challenges Polkadot faces in terms of relative performance and short-term market sentiment. It remains imperative to monitor potential catalysts and market dynamics that could influence Polkadot’s future trajectory.
Polkadot Price Trends and Technical Indicators
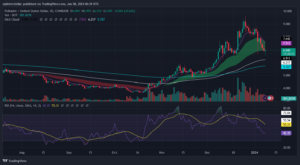
The current trend in Polkadot’s price is situated below the ascending line, indicating a potential continuation of the decline. Supporting this bearish outlook are technical indicators such as the Relative Strength Index (RSI), which gauges buying momentum. The RSI is on a downward trajectory, suggesting a decrease in buying pressure. Additionally, the rising Average Direction Index (ADX), measuring trend strength, signals an intensification of the downtrend.

DOT/USD Daily Chart- TradingView
These technical indicators collectively indicate that the selling pressure in the Polkadot market is strengthening, potentially leading to a further extension of the decline in the near term. Traders and investors are advised to closely monitor these indicators for potential trend reversals or shifts in market sentiment.
In the scenario of an uptrend, critical levels to observe for Polkadot are at $8 and $9, historically acting as resistance areas leading to rejections for the altcoin. Successfully surpassing these resistance levels would signify a significant breakthrough, setting the stage for a continuation of the upward trend.
Monitoring how Polkadot performs at these key levels can provide valuable insights for traders and investors, assisting them in gauging the strength and sustainability of the potential uptrend. These levels serve as crucial reference points for decision-making.
Polkadot’s Robust Performance and Future Projection
Over the past year, Polkadot’s DOT price has showcased a strong upward trend, witnessing an impressive surge of 50%. This substantial growth is consistently maintained above the 200-day simple moving average, indicating sustained positive momentum.
The current market value of DOT reflects a favorable performance relative to its token sale price, indicating substantial gains for early investors. Polkadot also boasts high liquidity, evident from its substantial market capitalization.
The amalgamation of consistent price appreciation, technical strength, positive deviation from the token sale price, and ample liquidity positions Polkadot as a noteworthy asset in the cryptocurrency landscape. This positioning may attract continued interest from investors and traders.
The forecast for Polkadot suggests a projected trading range between $6.16 and $15.13. Reaching the upper limit of this range implies a potential increase of over 110%, reaching the target price of $15.13. This forecast provides investors and market participants with a framework to assess potential price movements, considering factors that could influence Polkadot’s trajectory within this specified range.
Important: Please note that this article is only meant to provide information and should not be taken as legal, tax, investment, financial, or any other type of advice.
Join Cryptos Headlines Community
Follow Cryptos Headlines on Google News


