
BONK’s price has surged to an all-time high of $0.00000477 due to heightened demand, resulting in a significant boost to its market cap. However, technical indicators, including the RSI, signal potential overbought conditions, raising concerns about a forthcoming market reversal.
After a tug-of-war between bulls and bears in the Bonk (BONK) market earlier in the day, a support level formed at the day’s low of $0.00000308. This attracted buyers seeing an opportunity to enter the market at a lower price. As a result, the price bounced back, reaching an all-time high of $0.00000477. However, at this peak, sellers emerged, aiming to capitalize on gains and creating resistance.
At the latest update, BONK was valued at $0.00000457, marking a substantial 34.2% surge from the day’s low, indicating heightened demand, as per Coinstats data. Notably, BONK’s market capitalization and 24-hour trading volume witnessed impressive gains, increasing by 35.81% and 106.17%, respectively, reaching $240.32 million and $104.6 million.
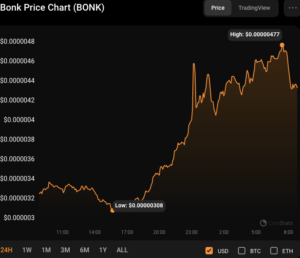
BONK/USD 24-hour price chart (source: CoinStats)
This upswing in market metrics reflects a growing interest from investors in BONK. The escalating buying pressure and positive sentiment suggest a potential continuation of BONK’s price uptrend. Should this bullish momentum breach the $0.00000477 resistance, the next noteworthy level is anticipated at $0.00000500, likely attracting more buyers and driving BONK’s price higher.
Conversely, if bears take charge and BONK fails to surpass the $0.00000477 barrier, the market might witness a brief consolidation or retracement. In such a scenario, keen attention should be paid to the $0.00000420 support level, as a breach below it could signal a shift in market sentiment, potentially leading to more bearish movements for BONK.
BONK Price Analysis: Indicators Signal Potential Reversal
The Bollinger bands’ significant expansion on the 4-hour price chart, ranging from upper and lower bands at $0.0000044657 and $0.0000019986, respectively, highlights substantial volatility and hints at a potential breakout for BONK.
Contrastingly, the ongoing price action unfolds as a red candlestick on the 4-hour chart, signaling an imminent retreat or reversal. This pattern indicates a diminishing bullish momentum in BONK, prompting a shift in the overall market sentiment.
Adding to the caution, the Relative Strength Index (RSI) reading of 70.24 points to BONK entering the overbought territory, suggesting a likely downturn or impending reversal. This signals that the buying pressure for BONK has reached a critical threshold, leading traders to contemplate profit-taking or liquidating their positions.
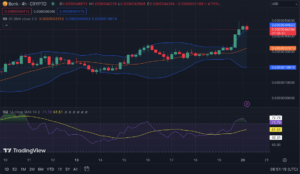
BONK/USD 4-hour price chart (source: TradingView)
In conclusion, BONK’s surge to new highs amid volatile market conditions presents both opportunity and caution, as key indicators point toward potential shifts in the near future.
Important: Please note that this article is only meant to provide information and should not be taken as legal, tax, investment, financial, or any other type of advice.
Join Cryptos Headlines Community
Follow Cryptos Headlines on Google News
Author