
Crypto analyst Ali Martinez, also known as @ali_charts on social media, conducted a recent technical analysis on Cardano (ADA) against the US dollar. According to Martinez’s analysis shared on X on February 23, a potential sell signal has emerged on the three-day chart for ADA.
Martinez’s analysis reveals a ‘9’ signal on the TD Sequential indicator, a common sign indicating a potential sell opportunity. This signal, observed on the candlestick chart spanning the last three days, is denoted by a red rectangle enclosing a green candlestick.
Critical Sell Signal Detected for Cardano (ADA)
In a recent analysis by crypto analyst Ali Martinez, a notable ‘9’ setup has emerged on the TD Sequential indicator for Cardano (ADA), suggesting a potential trend reversal or a signal to take profits. This indication, often viewed as a precursor to a change in direction, signals caution for ADA’s recent bullish trend. Martinez highlights that this isn’t the first time such a signal has appeared on Cardano’s chart.
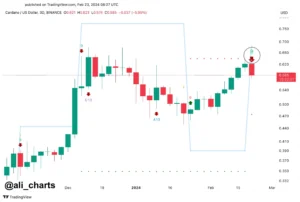
Cardano price analysis | Source: X @ali_charts
Historically, previous instances of the TD Sequential ‘9’ sell signal have been followed by price corrections for ADA. Traders are advised to remain vigilant, considering that the last two occurrences of this signal preceded downward price movements for Cardano. Martinez’s analysis underscores the importance of monitoring this development closely for potential market implications.
ADA/USD Technical Analysis: Bullish and Bearish Signals Interplay
As of February 23, 13:06 UTC, the ADA/USD pair presents a nuanced picture on the daily time frame, showcasing a mix of bullish and bearish signals amidst a constrained pattern following a decline from a local peak.
Currently, the ADA price stands at $0.5790, positioned above several key Exponential Moving Averages (EMAs). Notably, it remains above the 20-day EMA ($0.5733), 50-day EMA ($0.5462), 100-day EMA ($0.5065), and the significant 200-day EMA ($0.4487), hinting at an underlying bullish sentiment in the market.
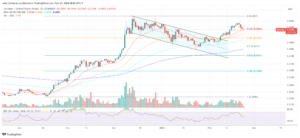
ADA price, 1-day chart | Source: ADAUSD on TradingView.com
Fibonacci retracement levels drawn from recent price movements highlight crucial support and resistance levels. The 0.236 level at $0.5866 acts as minor resistance, while the 0.382 level at $0.5203 and the 0.5 level at $0.4667 serve as key support zones to monitor for potential bearish reversals.
A breach below these levels could signify a deeper retracement towards the 0.618 level at $0.4131 or even the 0.786 level at $0.3368. However, the most critical support currently lies at the 20-day EMA, which could signal a trend change if breached.
Despite relatively consistent volume, recent price consolidation has seen a slight decrease in trading volume, suggesting a lack of strong conviction among traders. This sentiment is echoed by the Relative Strength Index (RSI) at 54, indicating a neutral stance with no clear directional bias at present.
In Summary
Although there are signs of potential price drops, there are also strong reasons to remain optimistic about Cardano’s future and not wait for a significant downturn. However, if the price fails to stay above important moving averages on the daily chart, it could confirm a shift in trend.
Important: Please note that this article is only meant to provide information and should not be taken as legal, tax, investment, financial, or any other type of advice.
Join Cryptos Headlines Community
Follow Cryptos Headlines on Google News
Author