
In the past 24 hours, DOT faced a decline of over 3%, witnessing increased liquidation and displaying bearish signals on market indicators. Despite this, Polkadot (DOT) continues to hold a prominent position in the list of crucial metrics indicating the level of decentralization.
This achievement aligns with the fundamental principle of blockchain technology, emphasizing decentralization. However, the question remains whether this noteworthy status will be sufficient to drive positive movements in DOT’s price chart.
Polkadot’s Nakamoto Coefficient Indicates Increasing Decentralization
Polkadot Insider recently shared a tweet spotlighting the blockchain’s Nakamoto coefficient, a metric revealing the minimum effort needed to disrupt a specific blockchain. A higher coefficient implies increased difficulty in breaking the blockchain, signifying enhanced decentralization.
As per the tweet, Polkadot’s Nakamoto coefficient has reached an impressive 92, a notable improvement from its April 2023 metric of 70. This underscores Polkadot’s commitment to bolstering decentralization.

While Polkadot joins the ranks of other notable blockchains like Mina Protocol (MINA), THORChain (RUNE), Avalanche (AVAX), and Solana (SOL) in prioritizing decentralization, investors should note that decentralization alone may not guarantee profitability for DOT.
Polkadot’s Recent Price Correction and Outlook
Polkadot (DOT) has undergone a recent price correction, with a decline of over 3% in the last 23 hours. Presently, according to CoinMarketCap, the token is trading at $7.13, boasting a market capitalization exceeding $8.9 billion.
Analysis indicates that DOT faced resistance, particularly around the $7.77 mark, leading to a notable increase in liquidation and subsequent price correction. The ability of DOT to surpass this key resistance level will be a key factor to monitor.
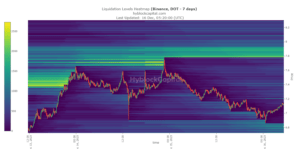
Source: Hyblock Capital
The daily chart of Polkadot reveals insights into its short-term prospects. The MACD indicator suggests a potential bearish crossover in the near future, adding an element of uncertainty to DOT’s immediate trajectory. Investors will be closely observing how the market unfolds and whether DOT can overcome current challenges.
Polkadot’s Indicators: MFI Downtick and Bollinger Bands Signal
Recent indicators on Polkadot (DOT) suggest a nuanced market sentiment. The Money Flow Index (MFI) has recorded a slight downtick from the overbought zone, indicating heightened selling pressure on the token.
Adding to the analysis, another noteworthy observation comes from DOT’s interaction with the upper limit of the Bollinger Bands. Historically, reaching this upper threshold often triggers a correction in the token’s price. This raises the possibility of a further decline in DOT’s price in the near term. Investors will be monitoring these indicators closely for insights into the potential trajectory of Polkadot.
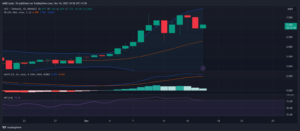
Source: TradingView
Important: Please note that this article is only meant to provide information and should not be taken as legal, tax, investment, financial, or any other type of advice.
Join Cryptos Headlines Community
Follow Cryptos Headlines on Google News
Author