
Whales holding between 100 and 1,000 BTC have stabilized their holdings since March 25, suggesting they’re not accumulating more Bitcoin. The Relative Strength Index (RSI) for the past 7 days has dropped from 76 to 69, indicating Bitcoin might be cooling off in the short term.
Additionally, the Exponential Moving Average (EMA) lines are close to forming a death cross, potentially signaling a downtrend for BTC.
Bitcoin Price Outlook: Cautious Signals Ahead
The Bitcoin (BTC) price outlook appears cautious as whales holding 100 to 1,000 BTC have stabilized their holdings since March 25, suggesting a halt in accumulation. Alongside this, the Relative Strength Index (RSI) has decreased from 76 to 69, indicating a short-term cooling of Bitcoin’s momentum.
Furthermore, the Exponential Moving Average (EMA) lines are approaching a death cross, a technical pattern that could foreshadow an upcoming downtrend for BTC. These combined indicators indicate a guarded stance for Bitcoin’s near future, with potential downward pressure on its price.
Bitcoin Whales: Impact on Market Sentiment
Since March 24, the number of wallets holding between 100 to 1,000 BTC, known as “whales,” has exhibited stability, fluctuating minimally between 13,872 and 13,841. This consistency indicates that these significant holders are not actively accumulating more BTC at the moment.
Whales, characterized as substantial cryptocurrency holders, possess the capacity to significantly influence market dynamics due to the size of their transactions. Monitoring their activity provides valuable insights into market trends and potential price shifts.
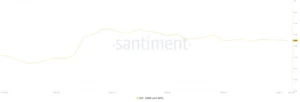
Source: Santiment.
The steadfast behavior of Bitcoin whales suggests a potential waning of interest, which holds significance in a market heavily influenced by sentiment and momentum. This pause in accumulation may signify a decline in confidence or a cautious approach from these major players.
Such a trend could signal a bearish outlook for BTC in the near future. If other investors perceive whales as losing interest or adopting a bearish stance, they may be inclined to sell, fearing an impending market downturn. This reactive behavior could initiate a cycle where apprehension regarding a decline contributes to its actual occurrence.
Bitcoin RSI Indicates Neutral Market Sentiment
The Bitcoin (BTC) 7-day Relative Strength Index (RSI) stands at 69, indicating a balanced market sentiment. While it falls short of the overbought threshold, it also avoids the oversold territory. This equilibrium suggests a potential decrease in interest in Bitcoin, leading to a phase of consolidation where neither buying nor selling forces dominate.
The RSI serves as a key momentum indicator in technical analysis, evaluating recent price movements to determine whether an asset is overbought (above 70) or oversold (below 30).
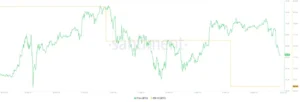
BTC RSI 7-Day. Source: Santiment.
At 69, Bitcoin hovers near the overbought threshold, but its stabilization within this neutral zone signifies a lack of significant momentum in either direction. Six days ago, the RSI declined from 76 to 69 as BTC stabilized in the $68,000 to $72,000 range.
This decrease from higher levels suggests a cooling off in Bitcoin’s fervor. The combination of the drop in RSI and price stabilization indicates declining interest or a collective pause among investors. Without new buying or selling pressures, this could set the stage for a shift in market dynamics in the near future.
BTC Nears Death Cross: Implications for Market Outlook
The Bitcoin (BTC) Exponential Moving Average (EMA) lines are approaching a death cross, a pattern often regarded as a bearish signal for the market. This occurs when the short-term moving average dips below the long-term average, suggesting a decline in recent momentum compared to the broader trend. Such a shift indicates a potential transition from bullish to bearish market conditions.
Importance of EMA Lines in Technical Analysis: EMA lines, unlike simple moving averages, prioritize recent price action to react more promptly to changes. They smooth price data over time, facilitating the tracking of price trends based on past performance for simplified market direction analysis. Consequently, EMA lines play a crucial role in technical analysis by enhancing the ability to discern the market’s trajectory.
Potential Price Movement Scenarios
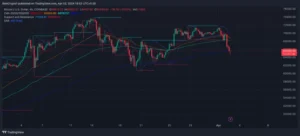
BTC 4H Price Chart and EMA Lines. Source: TradingView.
If the bearish trend signaled by the nearing death cross persists, BTC’s price could plummet to $59,200, particularly if the $62,300 support level fails to stem the decline. This potential drop may signify mounting selling pressure and a weakening market sentiment towards BTC.
However, there remains a possibility of a trend reversal. Should buyers regain control and propel the market into an uptrend, BTC could challenge the $71,700 resistance level. Achieving this would necessitate substantial buying pressure but could signify a resurgence of bullish sentiment and a potential reversal of the current bearish outlook.
Important: Please note that this article is only meant to provide information and should not be taken as legal, tax, investment, financial, or any other type of advice.
Join Cryptos Headlines Community
Follow Cryptos Headlines on Google News
Author