
The Dogecoin (DOGE) price surged significantly last week, breaking free from a 900-day descending resistance trendline. While the weekly RSI (Relative Strength Index) hasn’t turned fully bullish, the daily RSI supports the upward movement.
Price action appears bullish in both the daily and weekly timeframes. However, it’s worth noting that if DOGE closes below the $0.066 support area, it could jeopardize the ongoing upward trend.
The Dogecoin (DOGE) price recently broke above a long-term descending resistance trendline that had been intact since its all-time high. Surprisingly, instead of seeing a significant drop after the breakout, the price started moving upward just four days later.
Dogecoin (DOGE) Breaks Free from 900-Day Resistance
On the weekly chart, Dogecoin (DOGE) faced a declining resistance trendline since reaching its all-time high of $0.740 in May 2021. This downtrend caused the price to drop to $0.049 in June 2022.
While there were previous attempts to break above the trendline, they failed, resulting in lower highs and long upper wicks (depicted by red icons). However, this pattern changed recently when DOGE broke free from this 900-day resistance.
The price achieved a weekly closing above the trendline at $0.069, marking the first such close since the all-time high. The weekly Relative Strength Index (RSI) remains uncertain.
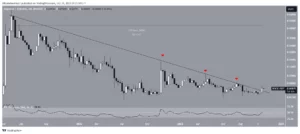
DOGE/USDT Weekly Chart. Source: TradingView
Traders use the RSI as a tool to spot moments when an asset might be overbought (too expensive) or oversold (too cheap). It helps them decide whether to buy or sell.
If the RSI is above 50 and moving up, it means the buyers are in control. But if it’s below 50, it’s the sellers who have the upper hand.
Right now, the RSI is at 50, and that means we’re not sure which way it’s going.
Analyst Opinions
Cryptocurrency analysts on X are optimistic about Dogecoin’s future.
ZAYKChart sees a big bullish wave coming, thanks to a long-term resistance trendline being breached.
$DOGE Seems like Ready for massive Bullish Wave📈#DOGE #DOGEUSDT #Dogecoin #Crypto pic.twitter.com/9abG4xsj8R
— ZAYK Charts (@ZAYKCharts) October 26, 2023
Rovercvc believes DOGE will outperform Bitcoin (BTC) due to strong DOGE/BTC chart support.
Rektcapital is more cautious, noting a less steep slope, and suggests that DOGE’s breakout might be delayed. If DOGE can maintain its highs and turn resistance into support, there’s still hope for an upward move.
The DOGE Price Outlook on Daily and Weekly Timeframes
On the daily timeframe, DOGE has shown a bullish trend after breaking free from the 900-day resistance trendline on October 20. This breakout also saw DOGE reclaim the $0.060 horizontal support area, indicating that the previous drop below it was just a temporary deviation.
The daily RSI, an indicator used to assess market momentum, is in bullish territory as it’s above 50 and trending upwards. This is typically seen as a sign of a bullish trend.
However, it’s important to note that DOGE faced resistance at the 0.618 Fibonacci retracement level, leading to a decline starting from October 26. In technical analysis, this Fibonacci level often determines whether an upward move is a correction or a trend reversal. To confirm a bullish reversal, DOGE needs to move above this level.
Important: Please note that this article is only meant to provide information and should not be taken as legal, tax, investment, financial, or any other type of advice.
Join Cryptos Headlines Community
Follow Cryptos Headlines on Google News