
The price of Ethereum is having a tough time going above the $3,030 mark. It’s kind of stuck and might begin to go down below the $2,930 support level. Recently, Ethereum tried to go past the $3,000 mark again, but it couldn’t quite make it.
The sellers were strong above $3,000, and even though it reached around $3,036, it started going down again, similar to what happened with Bitcoin.
Ethereum’s Price Movement and Key Levels
Ethereum’s price recently experienced a dip below the $3,000 and $2,980 levels, dropping below the 50% Fibonacci retracement level of its upward move from the $2,865 low to the $3,036 high. Despite this, the bulls have shown activity around the $2,940 mark.
Currently, Ethereum is trading above $2,930 and the 100-hourly Simple Moving Average. An important bullish trend line is forming, with support at $2,930 on the hourly chart of ETH/USD. This trend line coincides closely with both the 100-hourly Simple Moving Average and the 61.8% Fibonacci retracement level of the earlier upward move.
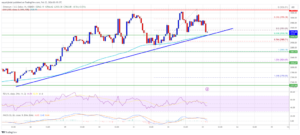
Source: ETHUSD on TradingView.com
Looking ahead, immediate resistance lies near the $2,980 level, followed by a major hurdle at $3,000. Beyond that, the next significant resistance is around $3,035. If Ethereum manages to surpass this level, it could aim for the $3,080 resistance zone. Further gains might propel it towards the $3,200 resistance, with potential for testing $3,250 if the bullish momentum continues.
Potential Ethereum Price Movement and Support Levels
If Ethereum fails to break through the $3,000 resistance barrier, it could face further downward pressure. Initial support is anticipated around the $2,930 level, in line with the 100-hourly Simple Moving Average.
The first significant support level lies near $2,865, followed by the key support zone around $2,820. A decisive move below $2,820 may lead to a downward trajectory towards $2,720. Subsequent losses could potentially drive the price towards the $2,550 level in the days ahead.
Technical Indicators
Hourly MACD: The MACD indicator for ETH/USD is showing signs of weakening momentum within the bullish zone.
Hourly RSI: The Relative Strength Index (RSI) for ETH/USD has dipped below the 50 level, indicating a potential shift towards bearish sentiment.
Key Levels to Watch
- Major Support Level: $2,865
- Major Resistance Level: $3,000
Important: Please note that this article is only meant to provide information and should not be taken as legal, tax, investment, financial, or any other type of advice.
Join Cryptos Headlines Community
Follow Cryptos Headlines on Google News
Author