
Bullish sentiment is growing for Fantom, hinting at a potential target of $1.44. However, crossing the $1 mark is crucial for FTM. Despite this optimism, selling pressure remains high, with indicators pointing towards a bearish trend.
The recent bear market hit Fantom hard, causing its price to drop by double digits in the past few days. Currently, the token’s price is stable, showing signs of consolidation. There’s potential for a breakout soon, which could push FTM to reach new highs.
Fantom (FTM) Overview
Fantom experienced a significant surge on March 16th, only to see the trend reverse shortly after, erasing its gains for the week. CoinMarketCap reported a 10% decrease in FTM’s value in the last 24 hours alone.
At the time of reporting, FTM was trading at $0.7912, boasting a market capitalization exceeding $2.2 billion.
The heightened volatility in FTM’s price sparked discussions among investors, leading to a notable increase in its Social Volume.
Despite the price decline, FTM’s Weighted Sentiment surged, indicating a prevailing bullish sentiment among market participants.
FTM Analysis: Roadblocks and Bearish Signals
On March 16th, crypto analyst Ali tweeted about FTM’s price consolidation, noting a potential target of $1.44 if the trend shifted.
Concerns arose regarding FTM’s ambitious target, prompting a review of its liquidation levels. Analysis indicated significant liquidation near $1, potentially hindering upward movement. Thus, surpassing $1 is pivotal for FTM’s progression.
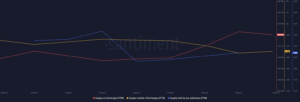
Source: Santiment
Santiment’s data highlighted bearish indicators for FTM. While Supply on Exchanges increased, Supply outside of Exchanges decreased, indicating heightened selling pressure. Additionally, a slight drop in supply held by top addresses suggested whale selling activity.
Analyzing Fantom’s Chart: Technical Indicators and Potential Trends
Upon reviewing Fantom’s daily chart, the MACD indicator hinted at a possible bearish crossover, signaling a potential downturn. Additionally, the Relative Strength Index (RSI) showed a downtick, moving towards the neutral mark. This downward trend suggested a continuation of FTM’s price decline in the near future.
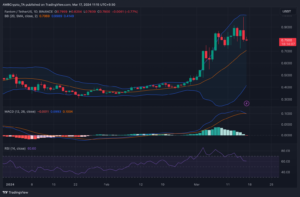
Source: TradingView
Observing FTM’s Bollinger Bands, it was noted that the token’s price remained above the 20-day simple moving average (SMA), indicating a crucial support level. This suggests that FTM might find support at this level, potentially initiating another bullish rally.
Conclusion
Despite the bearish signals from the MACD and RSI, the presence of key support at the 20-day SMA implies the possibility of FTM beginning another bullish trend after touching this support level.
Important: Please note that this article is only meant to provide information and should not be taken as legal, tax, investment, financial, or any other type of advice.
Join Cryptos Headlines Community
Follow Cryptos Headlines on Google News
Author