
The crypto market has become more unpredictable due to uncertainties surrounding the approval of spot Bitcoin ETFs. This has resulted in higher levels of ups and downs in the market.
The crypto market is still experiencing ups and downs because investors are unsure about the approval of spot Bitcoin ETFs. On December 3rd, there was a sudden selling spree in the market, triggered by concerns raised in a report from Matrixport. The report highlighted the possibility of the U.S. Securities and Exchange Commission (SEC) rejecting spot Bitcoin Exchange-Traded Funds (ETFs).
Crypto Market Analysis and Coin Trends Amid Regulatory Uncertainty
According to Matrix on Target’s report, the scrutiny of interactions between ETF applicants and the SEC staff suggests a crucial element is missing in these applications, which is necessary for SEC approval. This gap might lead to a delay in approval, potentially stretching until Q2 2024 or beyond.
The firm anticipates a potential rejection of all current proposals by the SEC in January, triggering substantial liquidation and a potential 20% decline in Bitcoin’s value. This could bring the price down to a range between $36,000 and $38,000.
As of December 5th, the global cryptocurrency market cap saw a 1.63% increase to $1.67 trillion, while the 24-hour trading volume decreased by 34.76% to $78.19 billion.
Amidst this uncertainty, certain cryptocurrencies like Solana (SOL), Celestia (TIA), and Kaspa (KAS) exhibit a bullish stance today.
Celestia Coin Surges Amid Market Uncertainty
In the midst of December’s crypto market uncertainties, Celestia coin has shown notable volatility, forming an expanding channel pattern as observed in its tops and bottoms. Despite the overall market trend, this altcoin experienced a significant uptick in the last three days, soaring from $9.36 to its current trading price of $16.18, marking an impressive 72.95% increase. The TIA token associated with Celestia serves as an indicative measure of the market’s sentiment toward modular blockchains.
With expectations of more airdrops, the demand for TIA is projected to rise as investors seek to acquire and stake it, particularly following airdrops by Saga and Dymension for TIA stakes. Holding TIA on its native platforms can potentially yield an annual return ranging from 15% to 17%, excluding fees.
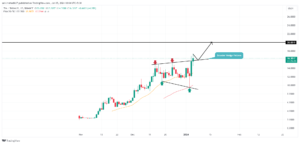
Celestia (TIA) Price| TradingView Chart
During this upward surge, the coin’s price breaks through the resistance trendline of the pattern, signaling a continuation of the uptrend. Post-breakout, there is optimism for the price to surge beyond the $20 mark.
Solana Price Correction and Potential Recovery
The Solana price experienced a corrective phase recently, retracting nearly 20% from its recent peak at $126.36 to find support around the $100 level and the 23.6% Fibonacci retracement level over a two-week period.
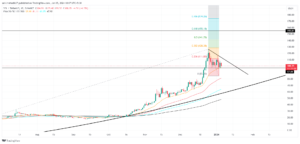
Solana(SOL) Price| TradingView Chart
Despite notable selling pressure on January 3, the daily chart displayed a significant long-tailed rejection candle at the $100 mark. This candle signals active buying interest at this level, indicating the robustness of Solana’s overall bullish trend. Investors may interpret this as a potential pause before the next price movement.
As of now, Solana is trading around $100, reflecting a 4.3% intraday decline. The correction introduces a new descending resistance trendline, providing dynamic resistance. In a bullish scenario, a breakthrough above this trendline could signify a continuation of the recovery, potentially propelling Solana’s price by 55% to a target of $155.
Kespa Coin Price Analysis: Flag Pattern and Recovery Potential
In the daily time frame chart, the Kespa coin’s price reveals a bullish continuation pattern identified as a FLAG. This pattern, influenced by the broader market correction, led to a 27.5% loss as the KAS price dropped from $0.1542 to $0.112.
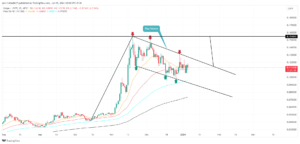
Kaspa(KAS) Price| TradingView Chart
As long as the FLAG pattern persists, the coin is likely to continue its correction within the confines of two descending trendlines.
Traders with a bullish outlook on this coin should closely monitor a potential breakout above the upper trendline. Such a breakout would signify a continuation of the recovery trend, with potential extensions leading the rise to $0.154 and possibly reaching $0.23.
The coin’s trading above the 100-and-200-day EMAs suggests that the overall bullish trend remains robust, providing additional support to the potential recovery scenario.
Important: Please note that this article is only meant to provide information and should not be taken as legal, tax, investment, financial, or any other type of advice.
Join Cryptos Headlines Community
Follow Cryptos Headlines on Google News
Author