Sees Surge in New Account Creation")


The Shiba Inu (SHIB) price is showing signs of a positive trend as it experiences a healthy retracement. Alongside this, the formation of a bullish chart pattern suggests the potential for SHIB to surpass the $0.000001 mark in the near future.

The Shiba Inu (SHIB) price is currently in a consolidation phase, influenced by Bitcoin’s struggle to break the $38,000 resistance. SHIB formed a local top at $0.00000965 and is now moving within converging trendlines, forming a bullish flag pattern. This pattern suggests a potential breakout for SHIB, with the chance of surpassing the $0.00001 barrier in the near future. The broader cryptocurrency market conditions, especially Bitcoin’s performance, play a role in shaping SHIB’s current trajectory.
Shiba Inu Price Prediction: Bullish Signals and Increased Trading Volume
The current outlook for Shiba Inu (SHIB) suggests a bullish trend, with signs pointing to a continuation of the uptrend. However, it’s crucial to monitor the lower support trendline, as a potential breakdown could indicate a weakening in bullish momentum, prompting a shift in the pattern.
Notably, the intraday trading volume for SHIB has surged to $208.5 million, marking a substantial gain of 28.5%. This uptick in trading activity introduces a dynamic element to the overall market conditions for SHIB, potentially influencing its short-term price movements. Traders and investors are closely observing these pattern developments and trading volumes to make well-informed decisions in the evolving SHIB market.

Source- Tradingview

Over the last month, Shiba Inu’s price has shown a notable increase, rising from $0.00000612 to the current level of $0.00000863, reflecting a 30% gain. However, the upward momentum faced resistance near $0.00000965 amid broader market uncertainties.
As a response to this resistance, there was a temporary pullback to approximately $0.000008, aligning with the 50% Fibonacci retracement level. In the context of a prolonged bullish trend, this level of retracement is often considered a healthy correction.
On the 4-hour timeframe chart, the consolidation phase is taking the form of a bullish continuation pattern known as a “flag.” Typically, such patterns involve a brief sideways movement before a decisive breakout to the upside. If SHIB successfully breaks out above the upper trendline of this flag pattern, it could set an initial target of $0.0000150, indicating a potential gain of 18%. Traders and investors are closely monitoring these developments for potential trading opportunities.
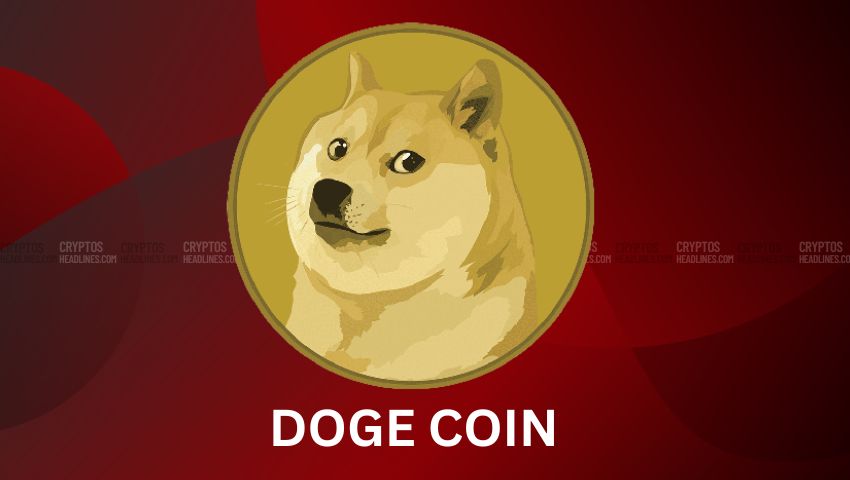
SHIB vs. DOGE Price Analysis: A Tale of Momentum
In a comparative analysis of the last three months, the price performance of Shiba Inu (SHIB) and its memecoin counterpart, Dogecoin (DOGE), reveals distinct patterns. DOGE has demonstrated stronger momentum, consistently establishing new highs and lows. Conversely, SHIB has encountered challenges in surpassing the $0.00000969 high, indicating a struggle for significant breakthroughs.
Market Sentiment and Long Position Opportunities:Given the prevailing bullish market sentiment, Dogecoin’s price trajectory may present a more favorable opportunity for those considering long positions. DOGE has exhibited a more robust trend during this period, contributing to its potential attractiveness for investors.
Technical Indicators
Relative Strength Index (RSI): Despite the RSI forming lower lows, signifying seller pressure, SHIB’s sustained uptrend suggests a higher likelihood of continued upward movement. The intact bullish trend may counterbalance the apparent selling pressure indicated by RSI.
Bollinger Bands: The converging bands on the Bollinger Bands indicator signal a market correction phase, typical before a potential breakout or trend continuation. Investors and traders often interpret this as a prelude to significant market moves, prompting heightened vigilance for potential opportunities.
As the market dynamics unfold, participants are closely monitoring these indicators to make informed decisions in response to evolving trends.
Important: Please note that this article is only meant to provide information and should not be taken as legal, tax, investment, financial, or any other type of advice.
Join Cryptos Headlines Community
Follow Cryptos Headlines on Google News