Polkadot (DOT) is currently facing challenges to stay above the $7 mark following a weekend dominated by selling pressure.
The price dipped to $6.93 on Sunday, reversing some of the gains made earlier in the week. Polkadot had shown strength in the previous week, with a notable increase of 6.58% over the past seven days.
Polkadot (DOT) Struggles Below $7 Despite Volatile Week
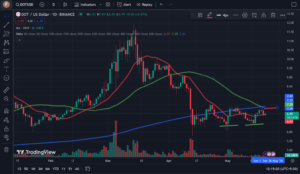
Polkadot (DOT) faced a challenging week as it struggled to maintain momentum above the crucial $7 mark. The week began with significant volatility, starting at $6.67 and experiencing swings between $6.43 and $6.82 before settling at $6.67. Tuesday saw a notable decline of 2.83%, pushing DOT to $6.48, though it found support around $6.40. The following session, however, saw a strong recovery of 7.44%, bringing DOT up to $6.96 but falling short of $7.

DOT Price Chart: Source – TradingView
On Thursday, DOT briefly surpassed $7, reaching $7.03 during another volatile session that saw it dip to $6.82 before recovering. Friday showed a modest gain of 2.42%, closing at $7.20 as buyer interest picked up. However, the weekend brought renewed selling pressure, pushing DOT down to $6.93 by Sunday, below the 20-day Simple Moving Average (SMA).
Currently trading around $7, DOT is experiencing a tug-of-war between buyers and sellers as market participants watch closely to see if it can regain and hold above the $7 threshold.
Polkadot (DOT) Faces Resistance at $7.50 Amidst Oscillating Price Action
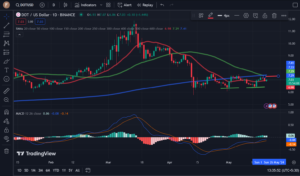
Polkadot (DOT) has demonstrated a resilient support level around $6.40 amidst its recent price movements. The chart reveals multiple instances where DOT has tested and bounced back from this level, signaling strong buying interest each time. However, over the past month, DOT has been oscillating within a range of $6.40 to $7.50, unable to sustain moves above the upper boundary.
The weekend saw DOT experiencing rejection and a subsequent drop, potentially retracing back towards its established support level before attempting another recovery. This pattern has repeated itself on three separate occasions recently.

Source – TradingView
For DOT to break out of this range-bound behavior and initiate a significant upward movement, it will need to surpass the $7.50 resistance level decisively. A successful breach above $7.50 could pave the way for DOT to target higher price levels such as $8 and potentially even $8.50. However, technical indicators such as the bearish cross of the 200-day Simple Moving Average (SMA) and the 50-day SMA may exert downward pressure on the price, warranting careful consideration.
Despite these indicators, the Moving Average Convergence Divergence (MACD) remains bullish, suggesting continued strong buying momentum in the market. Investors and traders are closely monitoring these technical signals to gauge the potential direction of DOT’s next major move.
Important: Please note that this article is only meant to provide information and should not be taken as legal, tax, investment, financial, or any other type of advice.
Join Cryptos Headlines Community
Follow Cryptos Headlines on Google News


