
Polkadot’s price has dropped significantly and settled around the important $6 level, showing only small changes that suggest there’s not much volatility.
However, it’s worth noting that Polkadot is still within a crucial range, suggesting that a significant price movement could happen soon.
Polkadot’s Current Market Dynamics: Analysis and Outlook
Source: TradingView
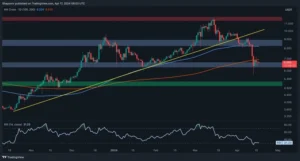
Taking a closer look at the daily chart, it’s evident that Polkadot has experienced a period of subdued price movement and sideways consolidation near the $6 mark. This follows a notable decline below both the 100 and 200-day moving averages, indicating a prevailing bearish sentiment with sellers dominating the market.
Despite this, Polkadot remains within a critical range, bounded by support at $6 and the significant 200-day moving average at $6.93.
A bullish breakout above the 200-day moving average could trigger sustained upward momentum, potentially targeting the crucial $10 level. Conversely, if bearish pressure persists, the downtrend may continue towards the substantial support level at $5.
Polkadot’s Short-Term Outlook: Analysis and Forecast
Source: TradingView
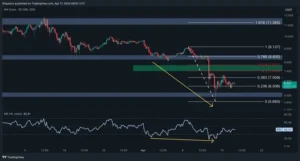
Analyzing the 4-hour timeframe reveals a notable drop in Polkadot’s price due to a significant long-squeeze event. However, this downward momentum was met with increased demand, leading to a modest rebound near the critical $6 level.
Additionally, a bullish divergence between the price and the RSI indicator on the 4-hour chart indicates the potential for corrective retracements in the short term. In this scenario, Polkadot is likely to continue its corrective movement, with the next targets lying within the price range between the 0.5 ($7.4) and 0.618 ($7.8) Fibonacci levels.
In summary, Polkadot remains within a pivotal range, with support at $6 and resistance at $9 in the broader perspective. The cryptocurrency is expected to oscillate within this range until a breakout occurs.
Assessing Polkadot’s Futures Market Dynamics
Source: CryptoQuant
The perpetual futures segment has emerged as a significant driver of crypto prices, often sparking heightened volatility and sudden shifts in value. When this market becomes overheated, characterized by aggressive long and short positions, it tends to spur such market dynamics. Thus, monitoring the futures market state is crucial for predicting upcoming price movements.
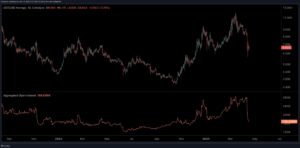
A key metric in this evaluation is Polkadot’s Open Interest (OI) chart, which tracks sentiment within the futures market alongside price movements. It quantifies the number of open perpetual futures contracts across various crypto exchanges. Typically, higher OI values correlate with increased volatility, while lower values signify calmer market conditions.
Analyzing the OI chart reveals a notable downturn in both the OI metric and Polkadot’s price. This decline coincides with recent geopolitical tensions in the Middle East, which have dampened market sentiment. The significant drop in Open Interest primarily results from the liquidation of a significant number of long positions in the perpetual markets.
Consequently, the market appears to be experiencing a cooling-off period, potentially paving the way for a renewed influx of both long and short positions in the futures market. This could, in turn, catalyze a fresh surge in market activity and increase the likelihood of intensified volatility.
Important: Please note that this article is only meant to provide information and should not be taken as legal, tax, investment, financial, or any other type of advice.
Join Cryptos Headlines Community
Follow Cryptos Headlines on Google News
Author