
Solana is displaying clear signs of breakout potential, but it’s crucial to examine the right chart to gauge the most accurate and timely insights.
Examining the SOL/ETH price chart offers investors a unique perspective beyond the traditional USD pairing. This analysis is crucial for uncovering local resistance and support levels, providing valuable insights into Solana’s performance against its main competitor, Ethereum. Understanding these dynamics becomes essential for gauging Solana’s market positioning and breakout potential.
Solana’s Hidden Potential: Analyzing the SOL/ETH Chart
The SOL/ETH chart, often overlooked in favor of its USD counterpart, serves as a key metric for evaluating internetwork competition and capital movements between two prominent blockchain ecosystems. Examining Solana’s value in relation to Ethereum provides insights into each blockchain’s relative investment appeal and technological momentum.
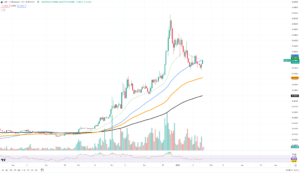
SOL/ETH Chart by TradingView
The current indications on the SOL/ETH chart suggest the potential for a breakout in Solana’s favor against Ethereum. This could signal an imminent surge in the meme coin market, DeFi activities, and other applications built on the Solana network. A rise in SOL against ETH reflects increasing investor confidence in Solana’s infrastructure, potentially anticipating market events or new developments.
Conversely, a decline in Solana’s value against Ethereum could favor ETH, indicating a shift in funds towards the more established network. These trends play a crucial role for investors aiming to understand the recovery and growth trajectories of both platforms.
Switching to the SOL/USDT chart, specific price levels indicate key support and resistance zones. Support levels represent points where a downtrend may halt due to increased demand, while resistance levels signify potential halts in an uptrend due to selling pressure.
As of the latest data, Solana has exhibited resilience around the $88.65 support level, suggesting a robust presence of buyers at this valuation. On the upside, resistance is observed near the $92.31 mark, historically attracting selling activity. Understanding these levels is essential for investors navigating Solana’s hidden potential against Ethereum.
Important: Please note that this article is only meant to provide information and should not be taken as legal, tax, investment, financial, or any other type of advice.
Join Cryptos Headlines Community
Follow Cryptos Headlines on Google News
Author