
BNB is approaching a breakout from a bullish pennant pattern, hinting at the potential for reaching a new all-time high. Despite lower volatility recently, Binance Coin’s momentum suggests it could soon surge significantly, with its price currently poised at a critical level.
BNB’s price has shown lower volatility in the past week. While several metrics appear bullish for BNB, there are a few indicators suggesting otherwise.
BNB Poised for Potential Breakout Above $580
The past week saw BNB maintaining relatively low volatility, with its price decreasing by only 1.5%. In the last 24 hours, there was minimal movement in its price.
As per CoinMarketCap data, BNB was trading at $580.59 at the time of writing, boasting a market capitalization exceeding $85.6 billion.
Despite recent stability, there’s optimism surrounding BNB’s future. Technical analysis reveals a bullish pennant pattern forming since mid-March, with BNB consolidating within it.
Currently, BNB is nearing a breakout from this bullish pattern. A successful breakout could trigger a substantial bullish rally, potentially surpassing its March highs.
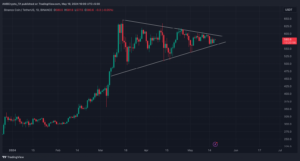
BNBUSDT CHART_ 18 May 24 _Source: TradingView
If conditions align favorably, BNB might even exceed its all-time high (ATH) of $661 in the coming weeks or months.
Additionally, on-chain metrics are supportive of a potential breakout. BNB’s Funding Rate remains low, typically indicating a potential price increase in the near term.
BNB’s Trading Volume and Sentiment Analysis
Recently, BNB’s trading volume experienced a decline, coinciding with a bearish price trend observed over the past few days. This subdued trading activity suggested that investors were holding back from actively trading BNB, indicating a potentially prolonged bearish sentiment. Additionally, market sentiment around BNB remained pessimistic, as reflected in its low Weighted Sentiment score.
Another concerning metric was the Long/Short Ratio for BNB, which had decreased at the time of reporting. A lower ratio typically indicates a bearish sentiment prevailing among traders, with a greater inclination towards selling or shorting the asset.
Analyzing BNB’s technical indicators, the Relative Strength Index (RSI) was observed to be moving sideways near the neutral mark. Similarly, the Chaikin Money Flow (CMF) exhibited a similar trend, suggesting stable but cautious market sentiment.
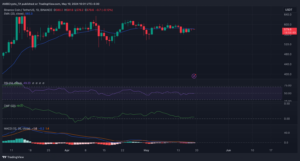
BNBUSDT CHART_ 19 May 24 _ Source: TradingView
At the time of assessment, BNB was testing its 20-day Exponential Moving Average (EMA). A successful move above this EMA could significantly increase the likelihood of BNB breaking out from its bullish pattern in the near future.
Important: Please note that this article is only meant to provide information and should not be taken as legal, tax, investment, financial, or any other type of advice.
Join Cryptos Headlines Community
Follow Cryptos Headlines on Google News
Author