
For the past few weeks, the price of Chainlink has been going up steadily. But in the last couple of days, it seems like the speed of this increase has slowed down.
What’s really catching attention is that big investors, known as whales, have been hinting that a price drop might be coming soon. They’ve been suggesting this for a while now, so it’s something to keep an eye on.
Chainlink Faces Resistance at $21.69 and Corrects by 5.66%
Chainlink’s recent surge led it to hit a 25-month high, reaching the $21.69 resistance level. However, shortly after, the Oracle token experienced a 5.66% correction, currently trading at $20.47.
There are signs indicating a potential downturn, particularly among whale investors who have been signaling this trend for some time. Addresses holding between 10,000 and 100,000 LINK have been consistently selling since February, resulting in a decline of nearly 2 million LINK, valued at over $40 million.
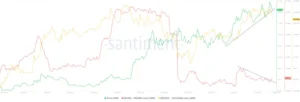
Chainlink Whale Supply. Source: Santiment
Whale investors significantly impact LINK’s price action, as they hold approximately 69% of the total circulating supply of LINK. The remaining 31% is held by smaller wallet holders.
Although a price decline has not yet materialized, the ongoing sales by whale investors suggest it may be imminent. The current sales are not as significant or sudden as seen in the past, leading to a bearish divergence that is expected to be corrected once LINK experiences a decline.
Chainlink’s Bullish Momentum Wanes Amidst MACD Signals
As Chainlink’s price gradually rises, its bullish momentum appears to be fading, particularly evident in shorter time frames. This observation is reinforced by negative signals from the Moving Average Convergence Divergence (MACD) indicator.
The MACD tracks the relationship between two moving averages of a security’s price, aiding in identifying trend direction, momentum, and potential buy or sell signals. It measures the difference between short-term (indicator line) and long-term moving averages (signal line).
At present, the MACD indicates a bearish crossover, accompanied by red candles on the histogram. Additionally, the 50-day Exponential Moving Average (EMA) is positioned above the candlestick, signaling a short-term bearish trend. This suggests a potential decline for Chainlink, possibly to around $20.12.
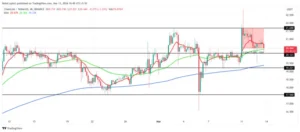
LINK/USDT 4-hour chart. Source: TradingView
If bearish sentiment persists, Chainlink’s price could further test support at $19.22. However, the 100-day EMA is currently acting as a support line, potentially preventing a significant decline. Sustaining above $20.12 may be crucial for LINK, with additional support from retail investors having the potential to reverse the downtrend. This would invalidate the bearish outlook, pushing the altcoin back above $21.
Important: Please note that this article is only meant to provide information and should not be taken as legal, tax, investment, financial, or any other type of advice.
Join Cryptos Headlines Community
Follow Cryptos Headlines on Google News
Author