Dogecoin, everyone’s favorite meme cryptocurrency, is showing signs that it might be heading for a price drop. Its trading volume has been going down, which could be a warning of a decline.
Cardano has caught the attention of traders with a pattern resembling a double top, suggesting a possible downturn. At the same time, Shiba Inu, another widely known cryptocurrency, is beginning to adjust its price following a period of fast growth.
Dogecoin’s Price Signals and Support Levels
Dogecoin, the market’s beloved meme cryptocurrency, is displaying signals that could hint at its future direction. Recently, there has been a decline in trading volume, often considered a cautionary indication of a potential price decrease.
Analyzing the current price chart reveals a local support level for DOGE around $0.1048. This level has previously served as a point of stabilization, leading to price rebounds. On the upside, there’s a clear resistance level at approximately $0.1439, which has been tested but not convincingly breached in recent trading sessions.
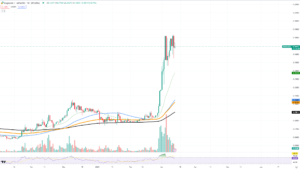
Dogecoin/USDT Chart by TradingView
The decreasing volume trend aligns with a stabilization in price following a significant surge. This pattern suggests that while interest in purchasing DOGE at higher prices diminishes, the market is lacking the momentum required to sustain upward movement.
While this trend doesn’t guarantee a drop, as other market factors could intervene to reignite buyer interest, a break below the current support level with continued low volume could validate a bearish outlook. This scenario could pave the way for further declines in Dogecoin’s price.
Cardano’s Double Top Pattern Raises Concerns
Cardano has attracted attention in the trading community due to the emergence of a pattern resembling a double top. This pattern, a bearish technical reversal, occurs when an asset reaches a high price twice in a row, with a moderate decline in between.
Visually, the double top pattern is characterized by two peaks at nearly the same price level. It typically signals resistance at this high point, suggesting that the asset may struggle to surpass it.
A closer look at ADA’s recent chart reveals two distinct peaks, indicating strong resistance. The first peak was followed by a sell-off, leading to a subsequent rise to a similar level, forming the second peak.
ADA’s support level is currently around $0.580, identified by past consolidations. If the double top pattern holds true, there’s a possibility of the price declining towards this support level. Meanwhile, resistance is seen around the $0.738 mark, coinciding with the peaks of the double top. A breakout above this level would invalidate the double top scenario, potentially signaling a bullish continuation.
Shiba Inu Faces Potential Price Correction
The cryptocurrency community is closely monitoring Shiba Inu as the asset recently displayed indications of a price correction. Despite its significant growth, this much-discussed cryptocurrency now confronts market realities with a possible reversal looming.
Analysis of the current price chart reveals that SHIB has encountered resistance at the $0.00003888 level, where its upward momentum has started to weaken. This resistance point holds significance as it has been tested multiple times, with SHIB struggling to sustain a consistent upward trajectory beyond this level.
On the downside, attention is focused on support levels. The first significant support is around $0.00003286, which could play a crucial role in the event of a continued downtrend. A breach below this level might trigger further selling pressure, potentially leading SHIB to test the next support level near $0.00002920.
Increasing selling pressure coupled with a decrease in buying momentum is often indicative of the onset of a correction phase. This combination signals a shift in trader sentiment from bullish to bearish, preceding a potential downward trend.
If SHIB fails to maintain its position above the immediate support level, there’s a possibility of the price declining towards the lower support at $0.00002836. At this level, bullish traders may attempt to regain control.
Important: Please note that this article is only meant to provide information and should not be taken as legal, tax, investment, financial, or any other type of advice.
Join Cryptos Headlines Community
Follow Cryptos Headlines on Google News
Author