
In recent times, Polkadot has experienced a surge in development activity alongside a notable increase in its price. The coin’s development remains active, reflecting ongoing efforts, and this coincides with a significant double-digit rise in its market value.
As we approach the end of 2023, the Polkadot (DOT) ecosystem continues to buzz with activity, marked by several noteworthy developments. The blockchain has seen increased attention and progress, coinciding with a positive turn in DOT’s price action, showcasing significant double-digit growth.
Polkadot’s Festive Season Development Buzz
Santiment’s data analysis unveils sustained high development activity within the Polkadot (DOT) blockchain during the festive season. The development activity graph for DOT remained notably elevated, maintaining momentum until December 25th.
A tweet from the popular X handle, formerly known as Twitter, under Polkadot Insider, sheds light on a couple of key developments potentially fueling this heightened activity. According to the tweet, DOT is gearing up for integration with the game engine that powers Pokémon Go and Call of Duty Mobile. This integration is made possible through a collaborative effort between Parity Technologies and Unity of Games.
In addition to this, Polkadot’s Parachain Crust network has strategically partnered with Algorand, marking another significant development contributing to the increased activity within the Polkadot ecosystem.
The #Polkadot and #Kusama ecosystems are growing impressively with great news on a daily basis 🗞️#PolkadotInsider is pleased to bring you the recap of highlight events in the @Polkadot and @kusamanetwork ecosystems in the last 72hrs 📰
Check it out 👇🧵#DOT #KSM pic.twitter.com/n1H25ksRx7
— Polkadot Insider (@PolkadotInsider) December 23, 2023
Polkadot’s Bullish Surge and Potential Sell Signal
In the midst of heightened development activity, Polkadot (DOT) experienced a notable uptick in its price action. CoinMarketCap reports a robust increase of over 35% in the last seven days for DOT.
Within the past 24 hours alone, Polkadot’s value surged by an impressive 6%, placing it at $9.36 in the current market scenario. With a market capitalization exceeding $11.8 billion, DOT currently holds the position as the 11th largest cryptocurrency.
However, recent insights from Ali, a prominent crypto analyst, suggest a potential sell signal for DOT. According to his tweet, a key resistance level at the 100-EMA on DOT’s weekly chart triggered this sell signal.
#Polkadot | The TD Sequential indicator flags a sell on the weekly chart for $DOT, just as it hits a key resistance at the 100-EMA.
This could lead to a spike in profit-taking, potentially driving #DOT down to $7.50. pic.twitter.com/3emT3apHiR
— Ali (@ali_charts) December 24, 2023
Further analysis indicates a surge in liquidation around the $9.5 zone for DOT. This spike in liquidation led to a minor price correction, preventing the token from surpassing the $9.5 mark in its recent trading activity.
Analyzing Polkadot’s Daily Chart: Potential Downtrend Signals
Examining Polkadot’s daily chart to assess the likelihood of a price downtrend, key indicators present a mixed picture. The Moving Average Convergence Divergence (MACD) remains favorable for buyers, showing a bullish crossover.
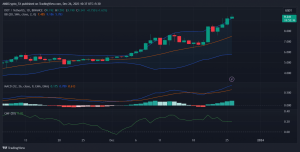
Source: TradingView
However, there are signals that warrant attention. The price has touched the upper limit of the Bollinger Bands, indicating a potential level of overextension. Additionally, the Chaikin Money Flow (CMF) has witnessed a downtick, suggesting the possibility of an impending price downtrend.
Traders and investors are advised to monitor these indicators for a comprehensive understanding of Polkadot’s current market dynamics.
Important: Please note that this article is only meant to provide information and should not be taken as legal, tax, investment, financial, or any other type of advice.
Join Cryptos Headlines Community
Follow Cryptos Headlines on Google News
Author