
SUI Price Prediction 2023: Bullish estimate – $1.15 to $1.35. SUI may reach $3 in the near future. Bearish estimate – $0.91.
In this SUI price prediction for 2023, we will analyze the price patterns of SUI using technical analysis indicators that are helpful for traders. We will also predict how the cryptocurrency may perform in the future.
Sui (SUI) Current Market Status
| Current Price | $1.06 |
| 24 – Hour Trading Volume | $177,614,650 |
| 24 – Hour Price Change | 6.83% Down |
| Circulating Supply | 528,273,718 |
| All – Time High | $1.72 (On May 03, 2023) |
SUI Current Market Status (Source: CoinMarketCap)
What is Sui (SUI)?
Sui is a platform that uses smart contracts and is maintained by a group of validators. These validators have a similar role to validators or miners in other blockchain systems. Sui has its own token called SUI, which is used to pay for transaction fees. Users can also stake their SUI tokens with validators in a model called Delegated Proof-of-Stake. This helps ensure the security and efficiency of the network. Sui improves scalability by allowing multiple transactions to be processed simultaneously.
Also Read This: Ethereum Price Prediction : Will ETH Surpass $2000 in May?
Sui (SUI) Price Prediction 2023
Sui (SUI) is currently ranked 72nd on CoinMarketCap based on its market capitalization. Looking ahead to 2023, let’s discuss the price prediction for Sui using a daily time frame.
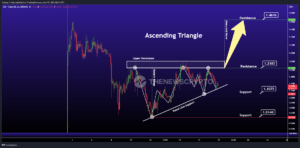
SUI/USDT Ascending Triangle Pattern (Source: TradingView)
The chart above shows an ascending triangle pattern for Sui (SUI). An ascending triangle is a pattern that typically appears during a positive market trend. It consists of a horizontal upper trendline connecting the highs and a lower trendline that connects the rising lows.
If the price breaks through the resistance level in this ascending triangle pattern, it is expected to continue rising.
During the analysis, the price of Sui (SUI) was $1.13. If the pattern continues, the price might reach resistance levels at $1.2185 and $1.4616. However, if the trend reverses, the price could fall to a support level of $1.0140.
Sui (SUI) Resistance and Support Levels
The chart below shows the predicted levels at which the price of Sui (SUI) may encounter resistance or find support in 2023.
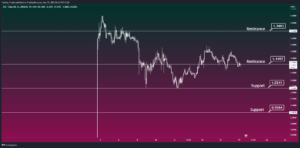
SUI/USDT Resistance and Support Levels (Source: TradingView)
From the above chart, we can analyze and identify the following as the resistance and support levels of Sui (SUI) for 2023.
| Resistance Level 1 | $1.1497 |
| Resistance Level 2 | $1.3483 |
| Support Level 1 | $1.0241 |
| Support Level 2 | $0.9084 |
As per the above analysis, if Sui’s (SUI) bulls take the lead, then it might hit and break through its resistance level of $1.3483.
If there are more people who believe that the price of SUI (SUI token) will decrease (bearish sentiment), then the price of SUI might drop significantly to $0.9084.
Also Read This: Arbitrum (ARB) 2023 Price Prediction: $2 Target
Sui (SUI) Price Prediction 2023 — RVOL, MA, and RSI
The chart below shows some technical analysis indicators for Sui (SUI), including Relative Volume (RVOL), Moving Average (MA), and Relative Strength Index (RSI). These indicators provide information about the trading activity, average price over a period of time, and the strength of the price trend for SUI.

SUI/USDT RVOL, MA, RSI (Source: TradingView)
The Relative Volume (RVOL) is a technical analysis indicator that measures how the trading volume of an asset compares to its average volume over a specific period, like the past 20 or 50 trading days. It helps traders by showing if the current trading volume is higher or lower than usual. This can indicate unusual trading activity and changes in market sentiment, which are important factors for making trading decisions.
During the analysis, it was observed that the RVOL of Sui (SUI) was below the cutoff line. This indicates that there is a low level of trading activity from participants in the current trend, suggesting weak volume.
The Moving Average (MA) is another technical indicator used to analyze market trends. It smooths out price data and helps identify the direction of the market. Specifically, the 50-day moving average (50 MA) calculates the average closing price of an asset over the past 50 days. If the asset’s price is higher than the 50 MA, it is considered to be in an uptrend or bullish. On the other hand, if the price is lower than the 50 MA, it is in a downtrend or bearish.
In the chart above, it’s worth noting that the price of SUI is below the 50-day moving average (50 MA), which suggests that it’s currently in a downtrend or bearish state. However, it’s important to remember that trends can change over time. So, while SUI is currently in a bearish state, there is a possibility of a trend reversal in the future.
The Relative Strength Index (RSI) is an analysis tool that helps traders assess the strength and momentum of an asset’s price movement within a certain timeframe. It calculates the RSI value by comparing the average gains and losses of the asset over the past 14 periods. The RSI value ranges from 0 to 100. Readings above 70 suggest that the asset is overbought, meaning it may be due for a price decline. Readings below 30 indicate an oversold state, suggesting the asset may be due for a price increase.
Traders commonly use the RSI to find possible changes in a trend or to confirm its direction. For example, if an asset is experiencing an upward trend and the RSI reaches a high reading of 70, it could indicate that the asset might experience a price decline or correction soon. On the other hand, if an asset is in a downward trend and the RSI reaches a low reading of 30, it could suggest a potential trend reversal or an upcoming price increase.
During the analysis, the RSI of SUI was found to be at 43.80. This suggests that SUI is currently neither in an overbought nor oversold state.
Sui (SUI) Price Prediction 2023 — ADX, RVI
In the chart below, we examine the strength and volatility of Sui (SUI) using two technical analysis indicators: the Average Directional Index (ADX) and the Relative Volatility Index (RVI). These indicators provide insights into the market’s trend strength and the level of price volatility for SUI.
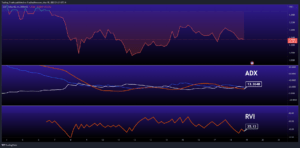
SUI/USDT ADX, RVI (Source: TradingView)
To assess the strength of the trend momentum, we can consider the Average Directional Index (ADX). The ADX value is calculated using two directional movement indicators, namely +DI and -DI. It is represented on a scale from 0 to 100.
Based on the data shown in the chart, the ADX of SUI is currently at 13.36, indicating a weak trend.
The chart above also shows the Relative Volatility Index (RVI), which measures the volatility of an asset’s price movement within a particular timeframe. In the provided data, the RVI of SUI is below 50, suggesting that there is currently low volatility in the price of SUI.
Comparison of SUI with BTC, ETH
Now, let’s compare the price movements of Sui (SUI) with those of Bitcoin (BTC) and Ethereum (ETH). We will analyze how the prices of these three assets have changed over time.

BTC Vs ETH Vs SUI Price Comparison (Source: TradingView)
Based on the chart provided, we can observe that the price of Sui (SUI) tends to move in a similar manner to that of Bitcoin (BTC) and Ethereum (ETH). This means that when the prices of BTC and ETH go up or down, the price of SUI also tends to follow the same pattern of increase or decrease.
Important: This article is intended solely for informational purposes. It should not be considered or relied upon as legal, tax, investment, financial, or any other form of advice.